SOHO MDI 2000-09-28 03:11:32 UT
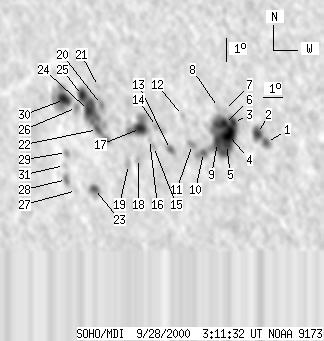
| group | Proj. U | Proj. WS | Corr. U | Corr. WS | B | L | LCM | Pos. angle | r | MU | MP |
| 112 | 510 | 75 | 338 | -11.74 | 350.61 | -37.06 | 116.69 | 0.6614 | -151.8 | 87.1 | |
|
previous
or next observation for the same group /
back to the solar disc SOHO MDI 2000-09-28 03:11:32 UT |
| spot | Proj. U | Proj. WS | Corr. U | Corr. WS | B | L | LCM | Pos. angle | r | MU | MP |
| 3 | 31 | 2 | 19 | -11.90 | 356.52 | -31.15 | 121.00 | 0.5927 | -1047.4 | -817.7 | |
| 8 | -1 | 5 | -1 | -11.56 | 356.14 | -31.52 | 120.19 | 0.5949 | -1081.5 | 999999 | |
| 4 | 134 | 3 | 84 | -11.18 | 355.06 | -32.60 | 118.80 | 0.6054 | -1370.0 | -598.7 | |
| 24 | -3 | 15 | -3 | -11.69 | 354.76 | -32.91 | 119.32 | 0.6124 | -1036.0 | 999999 | |
| 5 | -3 | 3 | -3 | -12.11 | 354.60 | -33.06 | 119.81 | 0.6170 | -684.8 | 999999 | |
| 5 | -3 | 3 | -3 | -11.25 | 354.63 | -33.04 | 118.58 | 0.6112 | -1216.8 | 999999 | |
| 0 | 3 | 0 | 2 | -10.71 | 354.69 | -32.97 | 117.84 | 0.6070 | -673.0 | -636.3 | |
| 0 | 5 | 0 | 3 | -10.61 | 354.42 | -33.24 | 117.49 | 0.6096 | -691.0 | -564.3 | |
| 9 | -3 | 6 | -3 | -12.05 | 354.18 | -33.48 | 119.42 | 0.6216 | 49.7 | 999999 | |
| 3 | 11 | 2 | 7 | -12.52 | 353.44 | -34.22 | 119.53 | 0.6333 | 388.7 | 522.5 | |
| 0 | 8 | 0 | 5 | -12.22 | 352.95 | -34.71 | 118.77 | 0.6372 | 596.0 | 481.0 | |
| 0 | 3 | 0 | 2 | -11.06 | 352.64 | -35.03 | 116.91 | 0.6340 | -456.0 | -319.6 | |
| 3 | 9 | 2 | 6 | -12.51 | 351.83 | -35.83 | 118.40 | 0.6520 | 689.7 | 532.9 | |
| 0 | 11 | 0 | 7 | -11.60 | 351.28 | -36.38 | 116.79 | 0.6532 | 676.0 | 486.8 | |
| 0 | 4 | 0 | 3 | -12.44 | 351.00 | -36.66 | 117.76 | 0.6613 | 379.0 | 520.3 | |
| 0 | 3 | 0 | 2 | -12.17 | 350.85 | -36.82 | 117.29 | 0.6615 | 500.0 | 491.6 | |
| 12 | 49 | 8 | 32 | -11.75 | 350.46 | -37.20 | 116.47 | 0.6636 | -803.6 | -307.0 | |
| 0 | 5 | 0 | 3 | -13.00 | 350.15 | -37.51 | 117.97 | 0.6741 | -481.0 | -409.0 | |
| 0 | 8 | 0 | 6 | -13.29 | 349.59 | -38.07 | 118.01 | 0.6821 | -498.0 | -326.8 | |
| 0 | 9 | 0 | 6 | -10.91 | 348.62 | -39.04 | 114.24 | 0.6806 | 1041.0 | 920.9 | |
| 0 | 3 | 0 | 2 | -10.18 | 348.58 | -39.08 | 113.22 | 0.6775 | 303.0 | 264.9 | |
| 4 | 105 | 3 | 72 | -11.96 | 348.24 | -39.42 | 115.43 | 0.6902 | 780.9 | 904.8 | |
| 5 | 19 | 4 | 14 | -14.44 | 347.60 | -40.07 | 118.30 | 0.7103 | 656.4 | 321.3 | |
| 7 | -22 | 5 | -22 | -11.21 | 347.90 | -39.76 | 114.24 | 0.6904 | 1193.9 | 999999 | |
| 8 | -22 | 6 | -22 | -10.61 | 347.69 | -39.97 | 113.33 | 0.6900 | 1081.8 | 999999 | |
| 0 | 8 | 0 | 6 | -11.13 | 347.29 | -40.37 | 113.81 | 0.6970 | 690.0 | 542.8 | |
| 0 | 4 | 0 | 3 | -14.60 | 346.60 | -41.06 | 117.93 | 0.7217 | 145.0 | 251.1 | |
| 0 | 10 | 0 | 7 | -14.18 | 346.16 | -41.50 | 117.15 | 0.7243 | 389.0 | 471.7 | |
| 0 | 6 | 0 | 4 | -13.05 | 346.41 | -41.26 | 115.84 | 0.7161 | 576.0 | 574.6 | |
| 12 | 58 | 8 | 40 | -10.86 | 346.71 | -40.95 | 113.14 | 0.7024 | 868.0 | 257.7 | |
| 0 | 4 | 0 | 3 | -13.60 | 346.18 | -41.48 | 116.43 | 0.7212 | 438.0 | 347.4 | |
| Proj. U | - Projected umbra area in millionths of solar disc, negative values indicate | |
|
that the umbra consists of fragmented regions which cannot be separated without losing umbral area. In this way several spots (intensity minima in the umbra) have a common umbra, e.g. -2 means that the given spot shares an umbra with spot No.2, and the common U value is indicated at spot No.2. |
||
| Proj. WS | - Projected whole spot area in millionths of solar disc, negative values indicate | |
|
that several umbras have a common penumbra, e.g. -7 means that the given umbra shares a penumbra with umbra No.7, and the WS value is indicated at No.7. |
||
| Corr. U | - Corrected umbra area in millionths of solar hemisphere, for negative values see above | |
| Corr. WS | - Corrected whole spot area in millionths of solar hemisphere, for negative values see above | |
| B | - Heliographic latitude B; positive: North, negative: South | |
| L | - Heliographic longitude L | |
| LCM | - Longitudinal distance from the Sun's central meridian | |
| Pos. angle | - Position angle | |
| r | - Distance from the centre of Sun's disc in terms of Sun's radius | |
| MU | - Mean magnetic field within the umbra contour averaged the pixel values with sign. | |
| MP | - Mean magnetic field within the penumbra contour averaged the pixel values with sign. | |