SOHO MDI 2000-08-19 01:35:31 UT
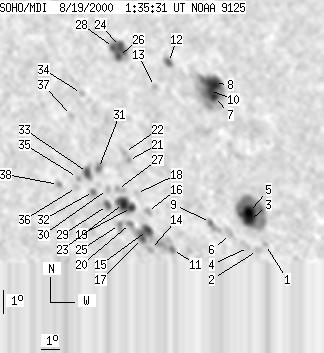
| group | Proj. U | Proj. WS | Corr. U | Corr. WS | B | L | LCM | Pos. angle | r | MU | MP |
| 102 | 583 | 65 | 382 | 24.98 | 235.15 | 38.27 | 300.79 | 0.6558 | -227.9 | -170.5 | |
|
previous
or next observation for the same group /
back to the solar disc SOHO MDI 2000-08-19 01:35:31 UT |
| spot | Proj. U | Proj. WS | Corr. U | Corr. WS | B | L | LCM | Pos. angle | r | MU | MP |
| 0 | 3 | 0 | 2 | 21.45 | 238.48 | 41.60 | 294.36 | 0.6806 | 353.0 | 310.7 | |
| 0 | 6 | 0 | 4 | 21.24 | 237.95 | 41.07 | 294.24 | 0.6739 | 768.0 | 670.2 | |
| 21 | 118 | 14 | 80 | 22.48 | 237.94 | 41.06 | 296.03 | 0.6777 | 1244.8 | 332.2 | |
| 0 | 10 | 0 | 6 | 21.40 | 237.50 | 40.62 | 294.62 | 0.6691 | 761.0 | 595.6 | |
| -3 | -3 | -3 | -3 | 22.81 | 238.00 | 41.12 | 296.47 | 0.6795 | 999999 | 999999 | |
| 0 | 9 | 0 | 6 | 21.99 | 236.70 | 39.82 | 295.77 | 0.6616 | 694.0 | 583.1 | |
| 8 | 136 | 5 | 94 | 27.70 | 238.05 | 41.17 | 303.22 | 0.6991 | -1093.7 | -716.9 | |
| 24 | -7 | 16 | -7 | 28.24 | 238.30 | 41.42 | 303.84 | 0.7040 | -960.9 | 999999 | |
| 0 | 14 | 0 | 9 | 22.56 | 235.79 | 38.90 | 296.95 | 0.6529 | 588.0 | 648.5 | |
| -8 | -7 | -8 | -7 | 27.97 | 237.88 | 41.00 | 303.66 | 0.6985 | 999999 | 999999 | |
| 0 | 35 | 0 | 22 | 21.61 | 233.44 | 36.55 | 296.52 | 0.6211 | 773.0 | 337.7 | |
| 4 | 13 | 2 | 9 | 29.31 | 236.08 | 39.20 | 306.32 | 0.6863 | -455.3 | -292.8 | |
| 0 | 3 | 0 | 2 | 28.36 | 234.85 | 37.97 | 305.67 | 0.6688 | 389.0 | 359.7 | |
| 0 | 6 | 0 | 4 | 21.68 | 232.30 | 35.42 | 297.16 | 0.6075 | 781.0 | 648.0 | |
| 6 | 37 | 4 | 23 | 22.46 | 232.37 | 35.49 | 298.34 | 0.6118 | -856.8 | -1.5 | |
| 0 | 7 | 0 | 4 | 23.23 | 232.60 | 35.72 | 299.41 | 0.6182 | -976.0 | -716.8 | |
| 4 | -15 | 2 | -15 | 22.16 | 232.02 | 35.14 | 298.04 | 0.6062 | 866.2 | 999999 | |
| 0 | 3 | 0 | 2 | 24.01 | 232.26 | 35.38 | 300.76 | 0.6178 | -513.0 | -472.0 | |
| 5 | 36 | 3 | 23 | 23.45 | 231.83 | 34.95 | 300.15 | 0.6099 | -886.0 | -921.0 | |
| 0 | 5 | 0 | 3 | 22.80 | 231.58 | 34.70 | 299.27 | 0.6038 | -547.0 | -414.8 | |
| 0 | 4 | 0 | 3 | 25.39 | 232.29 | 35.41 | 302.82 | 0.6251 | -757.0 | -723.5 | |
| 0 | 3 | 0 | 2 | 25.73 | 232.19 | 35.31 | 303.38 | 0.6258 | -788.0 | -730.3 | |
| 8 | -19 | 5 | -19 | 23.64 | 231.47 | 34.58 | 300.64 | 0.6066 | -1367.5 | 999999 | |
| 5 | 44 | 3 | 29 | 30.17 | 233.69 | 36.81 | 308.78 | 0.6668 | 694.2 | 638.5 | |
| 0 | 8 | 0 | 5 | 22.80 | 231.01 | 34.13 | 299.57 | 0.5969 | -770.0 | -581.1 | |
| 4 | -24 | 3 | -24 | 29.75 | 233.40 | 36.52 | 308.38 | 0.6614 | 1053.7 | 999999 | |
| 0 | 9 | 0 | 5 | 24.23 | 231.33 | 34.45 | 301.62 | 0.6080 | -625.0 | -567.7 | |
| 3 | -24 | 2 | -24 | 30.15 | 233.29 | 36.40 | 308.99 | 0.6626 | 960.3 | 999999 | |
| 4 | 10 | 2 | 6 | 23.61 | 230.62 | 33.74 | 301.06 | 0.5964 | -1054.2 | -754.7 | |
| 0 | 5 | 0 | 3 | 24.27 | 230.82 | 33.94 | 301.96 | 0.6021 | -826.0 | -613.5 | |
| 0 | 11 | 0 | 7 | 25.16 | 230.62 | 33.74 | 303.44 | 0.6047 | -803.0 | -693.9 | |
| 0 | 6 | 0 | 4 | 24.23 | 230.08 | 33.20 | 302.35 | 0.5932 | -879.0 | -664.7 | |
| 6 | 16 | 4 | 10 | 25.03 | 230.01 | 33.13 | 303.62 | 0.5969 | -1068.9 | -832.6 | |
| 0 | 5 | 0 | 3 | 28.32 | 230.79 | 33.91 | 308.00 | 0.6255 | -555.0 | -513.7 | |
| 0 | 4 | 0 | 2 | 24.85 | 229.44 | 32.55 | 303.72 | 0.5892 | -639.0 | -808.9 | |
| 0 | 6 | 0 | 4 | 24.45 | 229.27 | 32.38 | 303.19 | 0.5848 | -537.0 | -535.1 | |
| 0 | 5 | 0 | 3 | 27.44 | 229.94 | 33.06 | 307.28 | 0.6107 | -709.0 | -622.9 | |
| 0 | 6 | 0 | 3 | 24.62 | 228.40 | 31.51 | 304.04 | 0.5756 | -818.0 | -711.7 | |
| Proj. U | - Projected umbra area in millionths of solar disc, negative values indicate | |
|
that the umbra consists of fragmented regions which cannot be separated without losing umbral area. In this way several spots (intensity minima in the umbra) have a common umbra, e.g. -2 means that the given spot shares an umbra with spot No.2, and the common U value is indicated at spot No.2. |
||
| Proj. WS | - Projected whole spot area in millionths of solar disc, negative values indicate | |
|
that several umbras have a common penumbra, e.g. -7 means that the given umbra shares a penumbra with umbra No.7, and the WS value is indicated at No.7. |
||
| Corr. U | - Corrected umbra area in millionths of solar hemisphere, for negative values see above | |
| Corr. WS | - Corrected whole spot area in millionths of solar hemisphere, for negative values see above | |
| B | - Heliographic latitude B; positive: North, negative: South | |
| L | - Heliographic longitude L | |
| LCM | - Longitudinal distance from the Sun's central meridian | |
| Pos. angle | - Position angle | |
| r | - Distance from the centre of Sun's disc in terms of Sun's radius | |
| MU | - Mean magnetic field within the umbra contour averaged the pixel values with sign. | |
| MP | - Mean magnetic field within the penumbra contour averaged the pixel values with sign. | |