SOHO MDI 2000-08-18 22:23:31 UT
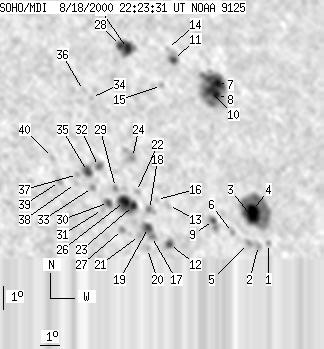
| group | Proj. U | Proj. WS | Corr. U | Corr. WS | B | L | LCM | Pos. angle | r | MU | MP |
| 89 | 539 | 59 | 348 | 25.12 | 235.19 | 36.54 | 301.87 | 0.6370 | -190.4 | -253.6 | |
|
previous
or next observation for the same group /
back to the solar disc SOHO MDI 2000-08-18 22:23:31 UT |
| spot | Proj. U | Proj. WS | Corr. U | Corr. WS | B | L | LCM | Pos. angle | r | MU | MP |
| 0 | 5 | 0 | 3 | 21.41 | 238.49 | 39.85 | 294.91 | 0.6600 | 501.0 | 378.0 | |
| 0 | 7 | 0 | 4 | 21.37 | 237.93 | 39.28 | 295.06 | 0.6532 | 846.0 | 684.0 | |
| 10 | 118 | 7 | 78 | 22.48 | 238.02 | 39.38 | 296.66 | 0.6582 | 1384.9 | 368.9 | |
| 10 | -3 | 6 | -3 | 22.81 | 238.08 | 39.43 | 297.11 | 0.6601 | 1177.5 | 999999 | |
| 0 | 6 | 0 | 4 | 21.49 | 237.42 | 38.78 | 295.43 | 0.6475 | 971.0 | 774.8 | |
| 0 | 4 | 0 | 3 | 21.99 | 236.71 | 38.07 | 296.47 | 0.6409 | 868.0 | 747.5 | |
| 8 | 122 | 5 | 82 | 28.16 | 238.20 | 39.56 | 304.60 | 0.6844 | -939.9 | -827.4 | |
| 6 | -7 | 4 | -7 | 27.70 | 237.94 | 39.30 | 304.10 | 0.6795 | -1141.0 | 999999 | |
| 3 | 13 | 2 | 8 | 22.55 | 235.86 | 37.22 | 297.67 | 0.6330 | 707.6 | 745.5 | |
| 7 | -7 | 5 | -7 | 27.90 | 237.63 | 38.98 | 304.52 | 0.6771 | -1414.8 | 999999 | |
| 4 | 16 | 3 | 11 | 29.33 | 236.18 | 37.54 | 307.24 | 0.6695 | -312.7 | -138.2 | |
| 3 | 10 | 2 | 6 | 21.73 | 233.30 | 34.66 | 297.61 | 0.5984 | 487.1 | 365.7 | |
| 0 | 7 | 0 | 4 | 23.32 | 233.71 | 35.06 | 299.88 | 0.6107 | -544.0 | -494.1 | |
| 0 | 3 | 0 | 2 | 29.82 | 236.05 | 37.40 | 307.97 | 0.6709 | 299.0 | 171.6 | |
| 0 | 4 | 0 | 3 | 28.29 | 235.07 | 36.42 | 306.43 | 0.6521 | 580.0 | 510.5 | |
| 0 | 3 | 0 | 2 | 23.60 | 233.17 | 34.52 | 300.61 | 0.6057 | -616.0 | -581.4 | |
| 0 | 5 | 0 | 3 | 22.11 | 232.48 | 33.83 | 298.65 | 0.5900 | -88.0 | -205.0 | |
| 0 | 9 | 0 | 6 | 23.22 | 232.69 | 34.04 | 300.28 | 0.5980 | -1090.0 | -765.1 | |
| 5 | 12 | 3 | 7 | 22.49 | 232.43 | 33.78 | 299.27 | 0.5912 | -926.0 | -673.3 | |
| 0 | 3 | 0 | 2 | 21.64 | 232.15 | 33.50 | 298.06 | 0.5836 | 606.0 | 546.3 | |
| 0 | 6 | 0 | 4 | 22.19 | 231.89 | 33.24 | 299.10 | 0.5831 | 637.0 | 545.1 | |
| 0 | 4 | 0 | 2 | 23.99 | 232.24 | 33.60 | 301.75 | 0.5967 | -538.0 | -489.6 | |
| 3 | 45 | 2 | 28 | 23.43 | 231.92 | 33.28 | 301.05 | 0.5899 | -958.9 | -920.1 | |
| 0 | 23 | 0 | 14 | 25.40 | 232.47 | 33.82 | 303.77 | 0.6071 | -775.0 | -668.4 | |
| 7 | 36 | 5 | 24 | 29.97 | 233.85 | 35.20 | 309.47 | 0.6493 | 856.2 | 659.1 | |
| 11 | -23 | 7 | -23 | 23.62 | 231.51 | 32.87 | 301.60 | 0.5860 | -1352.1 | 999999 | |
| 0 | 8 | 0 | 5 | 22.49 | 231.10 | 32.46 | 300.03 | 0.5749 | -767.0 | -716.9 | |
| 4 | -25 | 3 | -25 | 30.12 | 233.52 | 34.88 | 309.89 | 0.6469 | 965.2 | 999999 | |
| 0 | 4 | 0 | 3 | 24.22 | 231.22 | 32.58 | 302.72 | 0.5859 | -567.0 | -707.0 | |
| 3 | 10 | 2 | 6 | 23.63 | 230.70 | 32.05 | 302.12 | 0.5763 | -1102.4 | -909.1 | |
| 0 | 3 | 0 | 2 | 23.36 | 230.32 | 31.68 | 301.93 | 0.5702 | -894.0 | -755.1 | |
| 0 | 9 | 0 | 5 | 25.14 | 230.62 | 31.97 | 304.54 | 0.5841 | -769.0 | -784.0 | |
| 0 | 5 | 0 | 3 | 24.29 | 230.07 | 31.42 | 303.58 | 0.5726 | -669.0 | -732.9 | |
| 0 | 3 | 0 | 2 | 28.02 | 231.16 | 32.52 | 308.50 | 0.6087 | -420.0 | -545.7 | |
| 5 | 16 | 3 | 10 | 24.96 | 230.00 | 31.36 | 304.69 | 0.5759 | -1216.9 | -917.9 | |
| 0 | 5 | 0 | 3 | 28.34 | 230.85 | 32.20 | 309.18 | 0.6074 | -633.0 | -581.2 | |
| 0 | 3 | 0 | 2 | 24.87 | 229.47 | 30.82 | 304.91 | 0.5691 | -827.0 | -729.1 | |
| 0 | 3 | 0 | 2 | 24.51 | 229.27 | 30.62 | 304.48 | 0.5644 | -797.0 | -658.4 | |
| 0 | 5 | 0 | 3 | 24.63 | 228.50 | 29.85 | 305.24 | 0.5561 | -926.0 | -815.9 | |
| 0 | 4 | 0 | 2 | 25.64 | 228.42 | 29.77 | 306.91 | 0.5620 | -491.0 | -402.4 | |
| Proj. U | - Projected umbra area in millionths of solar disc, negative values indicate | |
|
that the umbra consists of fragmented regions which cannot be separated without losing umbral area. In this way several spots (intensity minima in the umbra) have a common umbra, e.g. -2 means that the given spot shares an umbra with spot No.2, and the common U value is indicated at spot No.2. |
||
| Proj. WS | - Projected whole spot area in millionths of solar disc, negative values indicate | |
|
that several umbras have a common penumbra, e.g. -7 means that the given umbra shares a penumbra with umbra No.7, and the WS value is indicated at No.7. |
||
| Corr. U | - Corrected umbra area in millionths of solar hemisphere, for negative values see above | |
| Corr. WS | - Corrected whole spot area in millionths of solar hemisphere, for negative values see above | |
| B | - Heliographic latitude B; positive: North, negative: South | |
| L | - Heliographic longitude L | |
| LCM | - Longitudinal distance from the Sun's central meridian | |
| Pos. angle | - Position angle | |
| r | - Distance from the centre of Sun's disc in terms of Sun's radius | |
| MU | - Mean magnetic field within the umbra contour averaged the pixel values with sign. | |
| MP | - Mean magnetic field within the penumbra contour averaged the pixel values with sign. | |