SOHO MDI 2000-07-27 03:16:31 UT
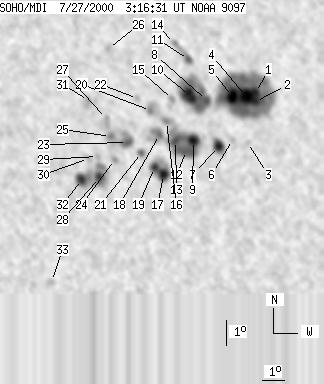
| group | Proj. U | Proj. WS | Corr. U | Corr. WS | B | L | LCM | Pos. angle | r | MU | MP |
| 160 | 959 | 93 | 549 | 6.83 | 171.07 | 30.80 | 274.03 | 0.5117 | 449.0 | 223.0 | |
|
previous
or next observation for the same group /
back to the solar disc SOHO MDI 2000-07-27 03:16:31 UT |
| spot | Proj. U | Proj. WS | Corr. U | Corr. WS | B | L | LCM | Pos. angle | r | MU | MP |
| 7 | 340 | 4 | 201 | 7.81 | 174.20 | 33.93 | 275.86 | 0.5580 | 979.7 | 581.1 | |
| 6 | -1 | 4 | -1 | 7.46 | 174.17 | 33.90 | 275.22 | 0.5574 | 1107.8 | 999999 | |
| 0 | 5 | 0 | 3 | 5.86 | 173.66 | 33.39 | 272.33 | 0.5500 | -85.0 | -236.8 | |
| 18 | -1 | 11 | -1 | 7.68 | 173.75 | 33.48 | 275.64 | 0.5516 | 1503.8 | 999999 | |
| 14 | -1 | 8 | -1 | 7.71 | 173.09 | 32.82 | 275.74 | 0.5419 | 1672.6 | 999999 | |
| 0 | 4 | 0 | 2 | 6.01 | 172.96 | 32.69 | 272.59 | 0.5397 | -26.0 | -138.5 | |
| 10 | 27 | 6 | 16 | 5.77 | 172.28 | 32.01 | 272.12 | 0.5298 | 1010.3 | 520.9 | |
| 5 | 132 | 3 | 76 | 7.61 | 171.85 | 31.58 | 275.64 | 0.5237 | 1172.7 | 856.4 | |
| 9 | 113 | 5 | 65 | 6.07 | 171.13 | 30.86 | 272.65 | 0.5127 | 1353.6 | 485.9 | |
| 20 | -8 | 11 | -8 | 7.85 | 171.08 | 30.81 | 276.15 | 0.5123 | 1560.3 | 999999 | |
| 4 | 9 | 2 | 5 | 9.27 | 171.16 | 30.89 | 278.92 | 0.5149 | 516.4 | 420.8 | |
| 15 | -9 | 9 | -9 | 5.69 | 170.79 | 30.52 | 271.90 | 0.5076 | 126.2 | 999999 | |
| 7 | -9 | 4 | -9 | 6.11 | 170.31 | 30.04 | 272.72 | 0.5003 | 256.6 | 999999 | |
| 0 | 11 | 0 | 6 | 9.94 | 170.57 | 30.30 | 280.33 | 0.5072 | -723.0 | -525.8 | |
| 0 | 5 | 0 | 3 | 7.73 | 170.28 | 30.01 | 275.98 | 0.5003 | 1034.0 | 827.8 | |
| 0 | 12 | 0 | 7 | 6.87 | 169.94 | 29.67 | 274.27 | 0.4948 | 580.0 | 604.0 | |
| 11 | 57 | 6 | 32 | 4.79 | 169.68 | 29.41 | 270.02 | 0.4914 | -1158.3 | -670.0 | |
| 2 | 26 | 1 | 14 | 6.38 | 169.59 | 29.32 | 273.27 | 0.4894 | -10.1 | -433.4 | |
| 6 | -17 | 4 | -17 | 5.08 | 169.29 | 29.02 | 270.59 | 0.4852 | -1288.4 | 999999 | |
| 0 | 22 | 0 | 13 | 7.34 | 169.24 | 28.97 | 275.27 | 0.4844 | 461.0 | 390.6 | |
| 2 | 7 | 1 | 4 | 5.70 | 168.73 | 28.46 | 271.85 | 0.4764 | -832.8 | -660.6 | |
| 0 | 6 | 0 | 3 | 7.84 | 168.69 | 28.42 | 276.37 | 0.4763 | -487.0 | -527.8 | |
| 8 | 27 | 4 | 15 | 6.13 | 168.12 | 27.85 | 272.74 | 0.4670 | -1082.3 | -901.6 | |
| 0 | 7 | 0 | 4 | 5.48 | 167.51 | 27.24 | 271.32 | 0.4576 | -955.0 | -776.8 | |
| 0 | 15 | 0 | 8 | 6.40 | 167.38 | 27.11 | 273.34 | 0.4555 | -1260.0 | -1032.3 | |
| 0 | 5 | 0 | 3 | 9.88 | 167.54 | 27.27 | 280.92 | 0.4617 | 984.0 | 823.3 | |
| 0 | 11 | 0 | 6 | 7.12 | 167.24 | 26.97 | 274.93 | 0.4536 | -692.0 | -716.6 | |
| 6 | 90 | 4 | 49 | 4.80 | 166.81 | 26.54 | 269.76 | 0.4471 | -1239.4 | -821.8 | |
| 0 | 4 | 0 | 2 | 5.63 | 166.76 | 26.49 | 271.63 | 0.4459 | -794.0 | -872.1 | |
| 0 | 4 | 0 | 2 | 5.57 | 166.35 | 26.08 | 271.47 | 0.4396 | -670.0 | -724.8 | |
| 0 | 12 | 0 | 6 | 7.86 | 166.49 | 26.22 | 276.68 | 0.4424 | -845.0 | -877.1 | |
| 10 | -28 | 6 | -28 | 4.75 | 166.01 | 25.74 | 269.57 | 0.4346 | -1468.6 | 999999 | |
| 0 | 8 | 0 | 4 | 0.77 | 164.61 | 24.34 | 259.87 | 0.4204 | -693.0 | -487.0 | |
| Proj. U | - Projected umbra area in millionths of solar disc, negative values indicate | |
|
that the umbra consists of fragmented regions which cannot be separated without losing umbral area. In this way several spots (intensity minima in the umbra) have a common umbra, e.g. -2 means that the given spot shares an umbra with spot No.2, and the common U value is indicated at spot No.2. |
||
| Proj. WS | - Projected whole spot area in millionths of solar disc, negative values indicate | |
|
that several umbras have a common penumbra, e.g. -7 means that the given umbra shares a penumbra with umbra No.7, and the WS value is indicated at No.7. |
||
| Corr. U | - Corrected umbra area in millionths of solar hemisphere, for negative values see above | |
| Corr. WS | - Corrected whole spot area in millionths of solar hemisphere, for negative values see above | |
| B | - Heliographic latitude B; positive: North, negative: South | |
| L | - Heliographic longitude L | |
| LCM | - Longitudinal distance from the Sun's central meridian | |
| Pos. angle | - Position angle | |
| r | - Distance from the centre of Sun's disc in terms of Sun's radius | |
| MU | - Mean magnetic field within the umbra contour averaged the pixel values with sign. | |
| MP | - Mean magnetic field within the penumbra contour averaged the pixel values with sign. | |