SOHO MDI 2000-07-26 20:47:31 UT
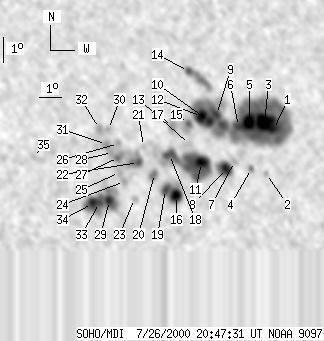
| group | Proj. U | Proj. WS | Corr. U | Corr. WS | B | L | LCM | Pos. angle | r | MU | MP |
| 157 | 1113 | 87 | 620 | 6.91 | 170.83 | 26.98 | 274.40 | 0.4535 | 499.0 | 182.2 | |
|
previous
or next observation for the same group /
back to the solar disc SOHO MDI 2000-07-26 20:47:31 UT |
| spot | Proj. U | Proj. WS | Corr. U | Corr. WS | B | L | LCM | Pos. angle | r | MU | MP |
| 7 | 536 | 4 | 303 | 7.30 | 174.19 | 30.34 | 275.14 | 0.5051 | 1171.0 | 683.8 | |
| 0 | 4 | 0 | 2 | 5.58 | 173.75 | 29.91 | 271.69 | 0.4985 | -569.0 | -395.3 | |
| 27 | -1 | 15 | -1 | 7.60 | 173.80 | 29.95 | 275.75 | 0.4994 | 1539.0 | 999999 | |
| 0 | 5 | 0 | 3 | 5.81 | 173.08 | 29.23 | 272.14 | 0.4882 | -234.0 | -183.0 | |
| 12 | -1 | 7 | -1 | 7.63 | 173.11 | 29.26 | 275.88 | 0.4890 | 1806.1 | 999999 | |
| 7 | -1 | 4 | -1 | 7.49 | 172.60 | 28.75 | 275.64 | 0.4812 | 1484.4 | 999999 | |
| 0 | 4 | 0 | 2 | 6.12 | 172.33 | 28.48 | 272.77 | 0.4766 | 714.0 | 616.0 | |
| 11 | 35 | 6 | 19 | 5.86 | 171.95 | 28.10 | 272.22 | 0.4709 | 1143.0 | 670.4 | |
| 4 | -1 | 2 | -1 | 8.01 | 171.64 | 27.79 | 276.84 | 0.4669 | 1054.6 | 999999 | |
| 7 | -1 | 4 | -1 | 7.75 | 171.30 | 27.46 | 276.31 | 0.4616 | 1511.4 | 999999 | |
| 11 | 150 | 6 | 83 | 6.15 | 170.84 | 27.00 | 272.82 | 0.4538 | 1489.9 | 168.9 | |
| 15 | -1 | 8 | -1 | 7.96 | 170.96 | 27.11 | 276.82 | 0.4564 | 1604.9 | 999999 | |
| 0 | 13 | 0 | 7 | 6.88 | 170.35 | 26.50 | 274.48 | 0.4463 | 647.0 | 548.7 | |
| 3 | 35 | 2 | 19 | 9.77 | 170.52 | 26.67 | 280.88 | 0.4523 | -819.7 | 46.4 | |
| 3 | 17 | 1 | 10 | 7.71 | 170.36 | 26.51 | 276.34 | 0.4469 | 1024.6 | 895.0 | |
| 10 | 57 | 6 | 32 | 4.89 | 169.67 | 25.83 | 269.93 | 0.4359 | -1304.5 | -800.9 | |
| 0 | 13 | 0 | 7 | 7.62 | 169.64 | 25.80 | 276.23 | 0.4357 | 352.0 | 397.5 | |
| 6 | -11 | 3 | -11 | 6.52 | 169.44 | 25.60 | 273.70 | 0.4320 | -548.5 | 999999 | |
| 5 | -16 | 3 | -16 | 5.15 | 169.20 | 25.35 | 270.49 | 0.4283 | -1431.2 | 999999 | |
| 0 | 11 | 0 | 6 | 5.80 | 168.75 | 24.90 | 272.01 | 0.4209 | -1037.0 | -839.1 | |
| 0 | 5 | 0 | 3 | 6.88 | 168.32 | 24.47 | 274.63 | 0.4144 | -676.0 | -529.2 | |
| 4 | 62 | 2 | 34 | 6.26 | 168.07 | 24.22 | 273.12 | 0.4102 | -984.4 | -942.4 | |
| 0 | 7 | 0 | 4 | 4.84 | 167.83 | 23.99 | 269.64 | 0.4068 | -760.0 | -625.8 | |
| 0 | 7 | 0 | 4 | 5.53 | 167.43 | 23.58 | 271.32 | 0.4000 | -844.0 | -729.2 | |
| 0 | 9 | 0 | 5 | 5.90 | 167.23 | 23.38 | 272.23 | 0.3967 | -872.0 | -822.8 | |
| 0 | 5 | 0 | 3 | 7.04 | 167.24 | 23.39 | 275.13 | 0.3973 | -862.0 | -786.5 | |
| 3 | -22 | 2 | -22 | 6.49 | 167.21 | 23.36 | 273.73 | 0.3966 | -1241.0 | 999999 | |
| 0 | 10 | 0 | 5 | 6.70 | 166.96 | 23.12 | 274.28 | 0.3927 | -658.0 | -500.6 | |
| 9 | 97 | 5 | 52 | 4.81 | 166.75 | 22.90 | 269.42 | 0.3895 | -1337.2 | -882.6 | |
| 0 | 4 | 0 | 2 | 7.61 | 166.84 | 22.99 | 276.63 | 0.3914 | -784.0 | -709.7 | |
| 0 | 7 | 0 | 4 | 7.02 | 166.72 | 22.87 | 275.14 | 0.3890 | -1127.0 | -849.7 | |
| 0 | 7 | 0 | 4 | 7.67 | 166.45 | 22.60 | 276.84 | 0.3853 | -900.0 | -815.1 | |
| 4 | -29 | 2 | -29 | 4.74 | 166.32 | 22.47 | 269.20 | 0.3826 | -1500.2 | 999999 | |
| 9 | -29 | 5 | -29 | 4.71 | 166.02 | 22.17 | 269.08 | 0.3778 | -1597.2 | 999999 | |
| 0 | 13 | 0 | 7 | 6.62 | 163.58 | 19.73 | 274.38 | 0.3378 | -502.0 | -665.2 | |
| Proj. U | - Projected umbra area in millionths of solar disc, negative values indicate | |
|
that the umbra consists of fragmented regions which cannot be separated without losing umbral area. In this way several spots (intensity minima in the umbra) have a common umbra, e.g. -2 means that the given spot shares an umbra with spot No.2, and the common U value is indicated at spot No.2. |
||
| Proj. WS | - Projected whole spot area in millionths of solar disc, negative values indicate | |
|
that several umbras have a common penumbra, e.g. -7 means that the given umbra shares a penumbra with umbra No.7, and the WS value is indicated at No.7. |
||
| Corr. U | - Corrected umbra area in millionths of solar hemisphere, for negative values see above | |
| Corr. WS | - Corrected whole spot area in millionths of solar hemisphere, for negative values see above | |
| B | - Heliographic latitude B; positive: North, negative: South | |
| L | - Heliographic longitude L | |
| LCM | - Longitudinal distance from the Sun's central meridian | |
| Pos. angle | - Position angle | |
| r | - Distance from the centre of Sun's disc in terms of Sun's radius | |
| MU | - Mean magnetic field within the umbra contour averaged the pixel values with sign. | |
| MP | - Mean magnetic field within the penumbra contour averaged the pixel values with sign. | |