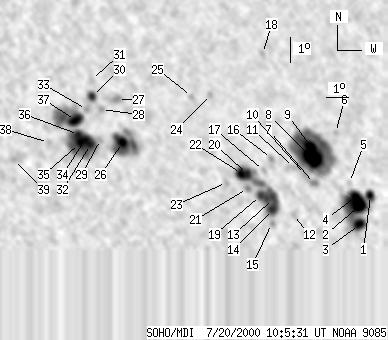
SOHO MDI 2000-07-20 10:05:31 UT
| group | Proj. U | Proj. WS | Corr. U | Corr. WS | B | L | LCM | Pos. angle | r | MU | MP |
| 185 | 907 | 104 | 516 | 13.07 | 257.31 | 28.14 | 289.00 | 0.4864 | -30.6 | -50.4 | |
|
previous
or next observation for the same group /
back to the solar disc SOHO MDI 2000-07-20 10:05:31 UT |
| spot | Proj. U | Proj. WS | Corr. U | Corr. WS | B | L | LCM | Pos. angle | r | MU | MP |
| 6 | 140 | 4 | 84 | 11.46 | 263.42 | 34.24 | 283.13 | 0.5685 | 537.6 | 924.9 | |
| 19 | -1 | 11 | -1 | 11.09 | 262.83 | 33.66 | 282.61 | 0.5595 | 1480.3 | 999999 | |
| 12 | -1 | 7 | -1 | 10.34 | 262.74 | 33.56 | 281.29 | 0.5568 | 1276.3 | 999999 | |
| 9 | -1 | 5 | -1 | 11.46 | 262.69 | 33.51 | 283.30 | 0.5582 | 1171.4 | 999999 | |
| 0 | 3 | 0 | 2 | 12.03 | 262.48 | 33.30 | 284.37 | 0.5565 | 662.0 | 509.6 | |
| 0 | 3 | 0 | 2 | 14.05 | 262.10 | 32.93 | 288.07 | 0.5568 | -382.0 | -421.4 | |
| 0 | 7 | 0 | 4 | 12.06 | 260.80 | 31.62 | 284.95 | 0.5328 | 781.0 | 521.2 | |
| 29 | 236 | 17 | 139 | 13.06 | 260.84 | 31.67 | 286.77 | 0.5362 | 1724.8 | 532.1 | |
| 11 | -8 | 6 | -8 | 13.58 | 260.82 | 31.65 | 287.73 | 0.5376 | 1128.9 | 999999 | |
| 0 | 5 | 0 | 3 | 12.44 | 260.42 | 31.25 | 285.77 | 0.5285 | 691.0 | 704.6 | |
| 0 | 9 | 0 | 5 | 12.74 | 259.89 | 30.72 | 286.53 | 0.5218 | 847.0 | 809.5 | |
| 0 | 9 | 0 | 5 | 10.87 | 259.66 | 30.49 | 283.05 | 0.5135 | -355.0 | -379.3 | |
| 5 | 131 | 3 | 75 | 11.55 | 258.81 | 29.63 | 284.64 | 0.5027 | -1376.6 | -726.3 | |
| 10 | -13 | 6 | -13 | 11.11 | 258.71 | 29.54 | 283.81 | 0.5001 | -1344.3 | 999999 | |
| 0 | 6 | 0 | 3 | 10.56 | 258.61 | 29.43 | 282.74 | 0.4972 | -443.0 | -627.0 | |
| 0 | 5 | 0 | 3 | 13.14 | 258.91 | 29.74 | 287.70 | 0.5091 | 653.0 | 653.3 | |
| 0 | 6 | 0 | 3 | 12.68 | 258.48 | 29.31 | 286.98 | 0.5013 | -113.0 | -165.2 | |
| 0 | 4 | 0 | 2 | 17.37 | 259.15 | 29.98 | 295.42 | 0.5301 | 741.0 | 601.7 | |
| 5 | -13 | 3 | -13 | 11.69 | 258.22 | 29.05 | 285.13 | 0.4945 | -98.6 | 999999 | |
| 6 | -13 | 3 | -13 | 12.55 | 257.72 | 28.55 | 287.05 | 0.4899 | -1321.9 | 999999 | |
| 0 | 8 | 0 | 4 | 11.99 | 257.66 | 28.48 | 285.96 | 0.4871 | -729.0 | -692.5 | |
| 10 | -13 | 6 | -13 | 12.60 | 257.45 | 28.28 | 287.27 | 0.4861 | -1331.6 | 999999 | |
| 0 | 5 | 0 | 3 | 12.27 | 256.73 | 27.55 | 286.93 | 0.4744 | 597.0 | 446.7 | |
| 0 | 5 | 0 | 3 | 15.81 | 256.45 | 27.28 | 294.21 | 0.4854 | 522.0 | 560.8 | |
| 0 | 5 | 0 | 3 | 15.77 | 255.57 | 26.39 | 294.71 | 0.4729 | 468.0 | 417.0 | |
| 10 | 86 | 5 | 47 | 14.03 | 252.24 | 23.07 | 293.48 | 0.4162 | -1612.2 | -841.4 | |
| 0 | 9 | 0 | 5 | 15.76 | 252.22 | 23.04 | 297.35 | 0.4259 | 808.0 | 590.8 | |
| 0 | 6 | 0 | 3 | 15.38 | 251.46 | 22.29 | 297.20 | 0.4128 | -832.0 | -759.8 | |
| 0 | 4 | 0 | 2 | 14.18 | 251.29 | 22.11 | 294.61 | 0.4031 | -828.0 | -827.8 | |
| 6 | 13 | 3 | 7 | 15.92 | 251.12 | 21.95 | 298.71 | 0.4115 | -859.3 | -705.0 | |
| 0 | 7 | 0 | 4 | 16.60 | 251.16 | 21.98 | 300.18 | 0.4167 | -234.0 | -299.6 | |
| 8 | 101 | 4 | 54 | 14.00 | 250.83 | 21.65 | 294.58 | 0.3954 | -1419.0 | -911.8 | |
| 0 | 5 | 0 | 3 | 15.40 | 250.80 | 21.62 | 297.87 | 0.4036 | -777.0 | -734.3 | |
| 17 | -32 | 9 | -32 | 14.24 | 250.63 | 21.46 | 295.34 | 0.3940 | -1761.4 | 999999 | |
| -34 | -32 | -34 | -32 | 14.05 | 250.35 | 21.18 | 295.14 | 0.3887 | 999999 | 999999 | |
| 6 | -32 | 3 | -32 | 14.41 | 250.34 | 21.17 | 296.01 | 0.3908 | -1514.7 | 999999 | |
| 16 | 78 | 9 | 42 | 14.98 | 250.27 | 21.09 | 297.41 | 0.3933 | -1329.2 | -838.5 | |
| 0 | 6 | 0 | 3 | 14.13 | 249.01 | 19.83 | 296.65 | 0.3697 | -601.0 | -415.1 | |
| 0 | 5 | 0 | 3 | 13.49 | 247.45 | 18.27 | 296.71 | 0.3428 | 992.0 | 855.6 | |
| Proj. U | - Projected umbra area in millionths of solar disc, negative values indicate | |
|
that the umbra consists of fragmented regions which cannot be separated without losing umbral area. In this way several spots (intensity minima in the umbra) have a common umbra, e.g. -2 means that the given spot shares an umbra with spot No.2, and the common U value is indicated at spot No.2. |
||
| Proj. WS | - Projected whole spot area in millionths of solar disc, negative values indicate | |
|
that several umbras have a common penumbra, e.g. -7 means that the given umbra shares a penumbra with umbra No.7, and the WS value is indicated at No.7. |
||
| Corr. U | - Corrected umbra area in millionths of solar hemisphere, for negative values see above | |
| Corr. WS | - Corrected whole spot area in millionths of solar hemisphere, for negative values see above | |
| B | - Heliographic latitude B; positive: North, negative: South | |
| L | - Heliographic longitude L | |
| LCM | - Longitudinal distance from the Sun's central meridian | |
| Pos. angle | - Position angle | |
| r | - Distance from the centre of Sun's disc in terms of Sun's radius | |
| MU | - Mean magnetic field within the umbra contour averaged the pixel values with sign. | |
| MP | - Mean magnetic field within the penumbra contour averaged the pixel values with sign. | |