SOHO MDI 2000-07-20 03:11:31 UT
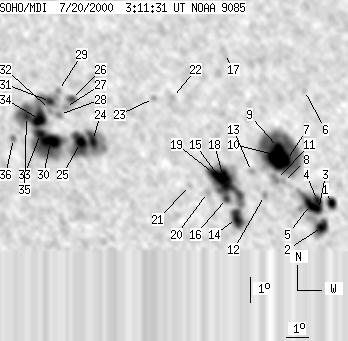
| group | Proj. U | Proj. WS | Corr. U | Corr. WS | B | L | LCM | Pos. angle | r | MU | MP |
| 224 | 948 | 126 | 518 | 13.31 | 256.66 | 23.68 | 292.42 | 0.4233 | -152.9 | -140.4 | |
|
previous
or next observation for the same group /
back to the solar disc SOHO MDI 2000-07-20 03:11:31 UT |
| spot | Proj. U | Proj. WS | Corr. U | Corr. WS | B | L | LCM | Pos. angle | r | MU | MP |
| 8 | 18 | 5 | 10 | 11.23 | 262.98 | 30.00 | 283.93 | 0.5073 | 805.4 | 530.3 | |
| 12 | 39 | 7 | 22 | 10.33 | 262.46 | 29.48 | 282.32 | 0.4976 | 1139.3 | 902.9 | |
| 6 | 66 | 3 | 38 | 11.02 | 262.35 | 29.37 | 283.72 | 0.4975 | 1272.1 | 947.7 | |
| 6 | -3 | 4 | -3 | 11.37 | 262.34 | 29.36 | 284.43 | 0.4984 | 1025.8 | 999999 | |
| 10 | -3 | 6 | -3 | 11.23 | 262.00 | 29.02 | 284.26 | 0.4930 | 1545.8 | 999999 | |
| 0 | 4 | 0 | 2 | 15.79 | 262.34 | 29.36 | 292.94 | 0.5143 | -732.0 | -498.7 | |
| 11 | 229 | 6 | 129 | 13.02 | 261.11 | 28.13 | 288.23 | 0.4855 | 1316.1 | 511.7 | |
| 0 | 4 | 0 | 2 | 12.19 | 260.87 | 27.89 | 286.66 | 0.4792 | 784.0 | 703.0 | |
| 37 | -7 | 21 | -7 | 13.56 | 260.81 | 27.83 | 289.45 | 0.4832 | 1732.6 | 999999 | |
| -9 | -7 | -9 | -7 | 13.24 | 260.72 | 27.74 | 288.86 | 0.4807 | 999999 | 999999 | |
| 0 | 9 | 0 | 5 | 12.28 | 260.56 | 27.58 | 286.99 | 0.4750 | 941.0 | 889.4 | |
| 0 | 5 | 0 | 3 | 11.67 | 259.95 | 26.97 | 285.98 | 0.4638 | -599.0 | -450.9 | |
| 0 | 5 | 0 | 3 | 12.65 | 259.46 | 26.48 | 288.28 | 0.4601 | 356.0 | 434.2 | |
| 15 | 28 | 9 | 16 | 10.80 | 258.60 | 25.62 | 284.68 | 0.4409 | -1312.9 | -960.5 | |
| 7 | 122 | 4 | 67 | 12.09 | 258.28 | 25.30 | 287.70 | 0.4404 | -1504.7 | -675.4 | |
| 3 | -15 | 2 | -15 | 11.61 | 258.23 | 25.25 | 286.66 | 0.4380 | 390.0 | 999999 | |
| 0 | 11 | 0 | 6 | 17.42 | 258.86 | 25.88 | 298.40 | 0.4754 | 610.0 | 543.5 | |
| 17 | -15 | 10 | -15 | 12.45 | 258.18 | 25.20 | 288.56 | 0.4404 | -1355.8 | 999999 | |
| 9 | -15 | 5 | -15 | 12.63 | 257.75 | 24.77 | 289.19 | 0.4347 | -550.0 | 999999 | |
| 0 | 4 | 0 | 2 | 11.88 | 257.41 | 24.43 | 287.71 | 0.4266 | 246.0 | 107.1 | |
| 0 | 5 | 0 | 3 | 12.19 | 256.64 | 23.66 | 288.86 | 0.4163 | 580.0 | 516.7 | |
| 0 | 4 | 0 | 2 | 15.73 | 256.27 | 23.29 | 297.10 | 0.4293 | 830.0 | 684.7 | |
| 0 | 4 | 0 | 2 | 15.72 | 255.42 | 22.44 | 297.84 | 0.4173 | 780.0 | 693.8 | |
| 9 | 124 | 5 | 66 | 14.11 | 252.58 | 19.60 | 296.91 | 0.3664 | -1187.5 | -689.1 | |
| 11 | -24 | 6 | -24 | 14.05 | 252.06 | 19.07 | 297.31 | 0.3583 | -1576.0 | 999999 | |
| 3 | 10 | 2 | 5 | 15.78 | 251.82 | 18.84 | 301.89 | 0.3676 | 594.8 | 401.3 | |
| 0 | 6 | 0 | 3 | 15.47 | 251.53 | 18.55 | 301.49 | 0.3612 | -440.0 | -286.2 | |
| 0 | 6 | 0 | 3 | 15.19 | 251.25 | 18.27 | 301.17 | 0.3551 | -849.0 | -675.6 | |
| 0 | 4 | 0 | 2 | 16.16 | 251.30 | 18.32 | 303.47 | 0.3634 | -482.0 | -318.4 | |
| 23 | 234 | 12 | 123 | 14.12 | 250.77 | 17.79 | 299.02 | 0.3403 | -1754.7 | -829.5 | |
| 5 | -30 | 3 | -30 | 15.72 | 250.91 | 17.93 | 302.94 | 0.3546 | -667.4 | 999999 | |
| 0 | 2 | 0 | 1 | 15.40 | 250.84 | 17.86 | 302.24 | 0.3510 | -775.0 | -708.5 | |
| 8 | -30 | 4 | -30 | 14.45 | 250.37 | 17.39 | 300.42 | 0.3371 | -1552.0 | 999999 | |
| 20 | -30 | 10 | -30 | 15.01 | 250.37 | 17.39 | 301.88 | 0.3415 | -1350.7 | 999999 | |
| 4 | -30 | 2 | -30 | 15.15 | 249.83 | 16.85 | 302.99 | 0.3350 | -1458.6 | 999999 | |
| 0 | 5 | 0 | 3 | 14.28 | 249.21 | 16.22 | 301.58 | 0.3192 | -956.0 | -718.0 | |
| Proj. U | - Projected umbra area in millionths of solar disc, negative values indicate | |
|
that the umbra consists of fragmented regions which cannot be separated without losing umbral area. In this way several spots (intensity minima in the umbra) have a common umbra, e.g. -2 means that the given spot shares an umbra with spot No.2, and the common U value is indicated at spot No.2. |
||
| Proj. WS | - Projected whole spot area in millionths of solar disc, negative values indicate | |
|
that several umbras have a common penumbra, e.g. -7 means that the given umbra shares a penumbra with umbra No.7, and the WS value is indicated at No.7. |
||
| Corr. U | - Corrected umbra area in millionths of solar hemisphere, for negative values see above | |
| Corr. WS | - Corrected whole spot area in millionths of solar hemisphere, for negative values see above | |
| B | - Heliographic latitude B; positive: North, negative: South | |
| L | - Heliographic longitude L | |
| LCM | - Longitudinal distance from the Sun's central meridian | |
| Pos. angle | - Position angle | |
| r | - Distance from the centre of Sun's disc in terms of Sun's radius | |
| MU | - Mean magnetic field within the umbra contour averaged the pixel values with sign. | |
| MP | - Mean magnetic field within the penumbra contour averaged the pixel values with sign. | |