SOHO MDI 2000-07-20 01:35:31 UT
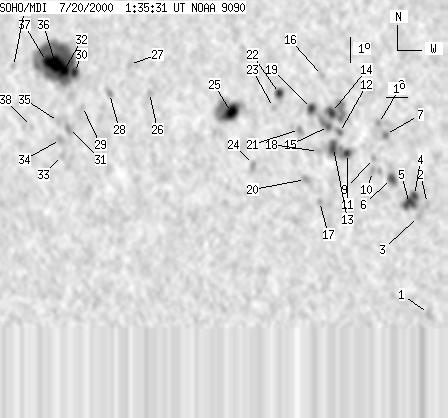
| group | Proj. U | Proj. WS | Corr. U | Corr. WS | B | L | LCM | Pos. angle | r | MU | MP |
| 103 | 646 | 60 | 383 | 12.24 | 201.79 | -32.07 | 74.72 | 0.5362 | 24.0 | 13.5 | |
|
previous
or next observation for the same group /
back to the solar disc SOHO MDI 2000-07-20 01:35:31 UT |
| spot | Proj. U | Proj. WS | Corr. U | Corr. WS | B | L | LCM | Pos. angle | r | MU | MP |
| 0 | 10 | 0 | 5 | 4.65 | 213.08 | -20.79 | 89.76 | 0.3553 | 445.0 | 457.7 | |
| 0 | 5 | 0 | 3 | 9.00 | 212.83 | -21.03 | 77.68 | 0.3643 | 841.0 | 677.4 | |
| 0 | 4 | 0 | 2 | 8.47 | 212.48 | -21.38 | 79.25 | 0.3687 | 638.0 | 583.1 | |
| 4 | 34 | 2 | 18 | 9.30 | 212.26 | -21.61 | 77.14 | 0.3743 | 1058.2 | 903.7 | |
| 9 | -4 | 5 | -4 | 8.98 | 212.06 | -21.80 | 78.08 | 0.3765 | 1195.7 | 999999 | |
| 5 | 15 | 3 | 8 | 9.94 | 211.22 | -22.65 | 75.99 | 0.3926 | 1135.2 | 790.4 | |
| 0 | 6 | 0 | 3 | 11.68 | 210.81 | -23.05 | 71.94 | 0.4050 | 1053.0 | 847.4 | |
| 0 | 4 | 0 | 2 | 12.11 | 210.47 | -23.40 | 71.14 | 0.4120 | 754.0 | 618.0 | |
| 0 | 5 | 0 | 3 | 10.71 | 210.37 | -23.49 | 74.52 | 0.4082 | 749.0 | 550.7 | |
| 0 | 15 | 0 | 8 | 10.19 | 210.37 | -23.50 | 75.77 | 0.4065 | 479.0 | 496.2 | |
| 4 | 44 | 2 | 24 | 10.87 | 209.21 | -24.66 | 74.72 | 0.4265 | 1147.2 | 830.3 | |
| 0 | 10 | 0 | 5 | 11.69 | 208.78 | -25.09 | 73.07 | 0.4358 | 998.0 | 699.9 | |
| 7 | -11 | 4 | -11 | 11.08 | 208.57 | -25.30 | 74.53 | 0.4369 | 972.8 | 999999 | |
| 6 | 43 | 3 | 24 | 12.47 | 208.34 | -25.52 | 71.57 | 0.4453 | 1135.6 | 244.0 | |
| 0 | 16 | 0 | 9 | 11.91 | 208.26 | -25.60 | 72.84 | 0.4443 | 1111.0 | 752.5 | |
| 0 | 5 | 0 | 3 | 13.93 | 207.77 | -26.10 | 68.78 | 0.4599 | -508.0 | -400.4 | |
| 0 | 5 | 0 | 3 | 8.92 | 208.13 | -25.74 | 79.59 | 0.4380 | -541.0 | -366.2 | |
| 0 | 8 | 0 | 4 | 10.90 | 207.91 | -25.95 | 75.23 | 0.4462 | 413.0 | 250.2 | |
| 5 | 14 | 3 | 8 | 12.60 | 207.42 | -26.44 | 71.79 | 0.4594 | 887.4 | 718.7 | |
| 0 | 6 | 0 | 3 | 9.77 | 207.43 | -26.43 | 77.91 | 0.4505 | -422.0 | -493.0 | |
| 0 | 7 | 0 | 4 | 11.74 | 206.97 | -26.89 | 73.82 | 0.4630 | 603.0 | 474.0 | |
| 6 | 14 | 3 | 8 | 13.14 | 205.90 | -27.97 | 71.44 | 0.4837 | 870.9 | 574.6 | |
| 0 | 5 | 0 | 3 | 12.57 | 205.69 | -28.17 | 72.68 | 0.4846 | 665.0 | 528.2 | |
| 0 | 8 | 0 | 5 | 10.27 | 205.02 | -28.84 | 77.60 | 0.4879 | 851.0 | 685.5 | |
| 15 | 73 | 8 | 42 | 12.30 | 203.78 | -30.09 | 74.02 | 0.5115 | 1275.6 | 474.5 | |
| 0 | 5 | 0 | 3 | 12.92 | 199.76 | -34.11 | 74.26 | 0.5700 | 449.0 | 335.8 | |
| 0 | 5 | 0 | 3 | 13.99 | 198.59 | -35.27 | 72.80 | 0.5888 | -454.0 | -478.9 | |
| 0 | 6 | 0 | 4 | 12.78 | 197.79 | -36.07 | 75.04 | 0.5965 | -1013.0 | -712.5 | |
| 0 | 5 | 0 | 3 | 12.20 | 196.52 | -37.34 | 76.31 | 0.6125 | -638.0 | -529.0 | |
| 5 | 229 | 3 | 146 | 13.53 | 195.87 | -37.99 | 74.33 | 0.6238 | -1125.2 | -544.9 | |
| 0 | 9 | 0 | 6 | 11.29 | 195.95 | -37.91 | 77.89 | 0.6185 | -791.0 | -781.6 | |
| 14 | -30 | 9 | -30 | 13.54 | 195.30 | -38.56 | 74.45 | 0.6313 | -1454.7 | 999999 | |
| 0 | 8 | 0 | 5 | 10.21 | 195.81 | -38.06 | 79.67 | 0.6189 | -715.0 | -659.6 | |
| 0 | 9 | 0 | 6 | 10.83 | 195.61 | -38.25 | 78.69 | 0.6224 | -922.0 | -815.2 | |
| 0 | 4 | 0 | 3 | 11.54 | 195.40 | -38.47 | 77.59 | 0.6263 | -863.0 | -813.4 | |
| 16 | -30 | 11 | -30 | 13.84 | 194.82 | -39.04 | 74.11 | 0.6382 | -1398.0 | 999999 | |
| 7 | -30 | 4 | -30 | 13.89 | 194.34 | -39.53 | 74.14 | 0.6445 | -893.4 | 999999 | |
| 0 | 5 | 0 | 3 | 11.27 | 194.03 | -39.83 | 78.25 | 0.6439 | -525.0 | -490.8 | |
| 0 | 5 | 0 | 4 | 13.60 | 192.63 | -41.23 | 74.96 | 0.6657 | -591.0 | -385.9 | |
| Proj. U | - Projected umbra area in millionths of solar disc, negative values indicate | |
|
that the umbra consists of fragmented regions which cannot be separated without losing umbral area. In this way several spots (intensity minima in the umbra) have a common umbra, e.g. -2 means that the given spot shares an umbra with spot No.2, and the common U value is indicated at spot No.2. |
||
| Proj. WS | - Projected whole spot area in millionths of solar disc, negative values indicate | |
|
that several umbras have a common penumbra, e.g. -7 means that the given umbra shares a penumbra with umbra No.7, and the WS value is indicated at No.7. |
||
| Corr. U | - Corrected umbra area in millionths of solar hemisphere, for negative values see above | |
| Corr. WS | - Corrected whole spot area in millionths of solar hemisphere, for negative values see above | |
| B | - Heliographic latitude B; positive: North, negative: South | |
| L | - Heliographic longitude L | |
| LCM | - Longitudinal distance from the Sun's central meridian | |
| Pos. angle | - Position angle | |
| r | - Distance from the centre of Sun's disc in terms of Sun's radius | |
| MU | - Mean magnetic field within the umbra contour averaged the pixel values with sign. | |
| MP | - Mean magnetic field within the penumbra contour averaged the pixel values with sign. | |