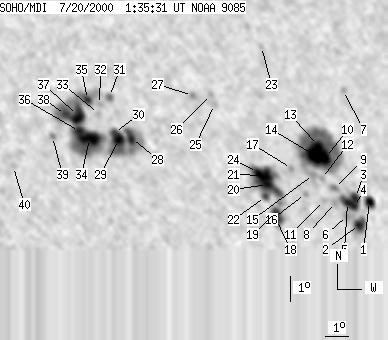
SOHO MDI 2000-07-20 01:35:31 UT
| group | Proj. U | Proj. WS | Corr. U | Corr. WS | B | L | LCM | Pos. angle | r | MU | MP |
| 226 | 1012 | 125 | 550 | 13.29 | 256.39 | 22.53 | 293.40 | 0.4066 | -223.8 | -139.3 | |
|
previous
or next observation for the same group /
back to the solar disc SOHO MDI 2000-07-20 01:35:31 UT |
| spot | Proj. U | Proj. WS | Corr. U | Corr. WS | B | L | LCM | Pos. angle | r | MU | MP |
| 8 | 20 | 5 | 11 | 11.22 | 262.88 | 29.02 | 284.26 | 0.4930 | 840.5 | 516.2 | |
| 11 | 34 | 6 | 19 | 10.33 | 262.33 | 28.47 | 282.63 | 0.4825 | 1259.9 | 737.7 | |
| 7 | 53 | 4 | 30 | 11.41 | 262.26 | 28.40 | 284.86 | 0.4843 | 1066.4 | 975.7 | |
| 5 | -3 | 3 | -3 | 11.05 | 262.18 | 28.31 | 284.16 | 0.4820 | 1363.3 | 999999 | |
| 7 | -3 | 4 | -3 | 11.22 | 261.87 | 28.01 | 284.63 | 0.4780 | 1482.8 | 999999 | |
| 0 | 14 | 0 | 8 | 10.71 | 261.82 | 27.96 | 283.58 | 0.4758 | 1149.0 | 959.7 | |
| 0 | 6 | 0 | 3 | 15.70 | 262.27 | 28.40 | 293.33 | 0.5007 | -733.0 | -611.2 | |
| 0 | 7 | 0 | 4 | 11.24 | 261.33 | 27.47 | 284.88 | 0.4700 | 694.0 | 517.5 | |
| 0 | 7 | 0 | 4 | 11.84 | 261.35 | 27.48 | 286.12 | 0.4721 | 961.0 | 731.3 | |
| 15 | 235 | 8 | 132 | 13.05 | 261.07 | 27.21 | 288.76 | 0.4724 | 1357.1 | 528.7 | |
| 0 | 6 | 0 | 3 | 11.34 | 260.84 | 26.98 | 285.29 | 0.4630 | 108.0 | 164.8 | |
| 0 | 4 | 0 | 2 | 12.22 | 260.80 | 26.93 | 287.17 | 0.4652 | 782.0 | 691.0 | |
| 8 | -10 | 5 | -10 | 13.54 | 260.81 | 26.95 | 289.91 | 0.4705 | 1196.0 | 999999 | |
| 26 | -10 | 15 | -10 | 13.15 | 260.58 | 26.72 | 289.22 | 0.4656 | 1923.3 | 999999 | |
| 0 | 7 | 0 | 4 | 12.39 | 260.45 | 26.59 | 287.70 | 0.4608 | 1078.0 | 949.2 | |
| 0 | 5 | 0 | 3 | 11.65 | 260.01 | 26.15 | 286.33 | 0.4516 | -589.0 | -407.1 | |
| 0 | 5 | 0 | 3 | 12.67 | 259.49 | 25.63 | 288.80 | 0.4476 | 529.0 | 472.3 | |
| 11 | 32 | 6 | 18 | 10.67 | 258.62 | 24.76 | 284.76 | 0.4274 | -1310.7 | -956.3 | |
| 5 | -18 | 3 | -18 | 10.98 | 258.65 | 24.79 | 285.48 | 0.4289 | -1379.9 | 999999 | |
| 9 | 124 | 5 | 68 | 12.07 | 258.35 | 24.49 | 288.12 | 0.4283 | -1515.0 | -647.1 | |
| 15 | -20 | 8 | -20 | 12.43 | 258.35 | 24.48 | 288.94 | 0.4296 | -1258.0 | 999999 | |
| 3 | -20 | 2 | -20 | 11.60 | 258.22 | 24.36 | 287.11 | 0.4245 | 605.6 | 999999 | |
| 0 | 4 | 0 | 2 | 17.61 | 258.76 | 24.90 | 299.59 | 0.4634 | 625.0 | 557.7 | |
| 9 | -20 | 5 | -20 | 12.56 | 257.96 | 24.10 | 289.47 | 0.4244 | -1006.3 | 999999 | |
| 0 | 6 | 0 | 3 | 15.34 | 256.35 | 22.48 | 296.99 | 0.4156 | 688.0 | 612.5 | |
| 0 | 4 | 0 | 2 | 15.75 | 256.22 | 22.35 | 298.01 | 0.4164 | 850.0 | 714.8 | |
| 0 | 6 | 0 | 3 | 15.74 | 255.42 | 21.55 | 298.76 | 0.4051 | 823.0 | 660.7 | |
| 5 | 409 | 3 | 215 | 14.09 | 252.60 | 18.73 | 297.82 | 0.3537 | -1299.3 | -721.6 | |
| 12 | -28 | 6 | -28 | 14.06 | 252.03 | 18.17 | 298.41 | 0.3454 | -1597.2 | 999999 | |
| 3 | -28 | 2 | -28 | 14.35 | 251.89 | 18.02 | 299.34 | 0.3454 | -1117.5 | 999999 | |
| 0 | 8 | 0 | 4 | 15.80 | 251.80 | 17.93 | 303.12 | 0.3553 | 350.0 | 356.9 | |
| 0 | 4 | 0 | 2 | 15.49 | 251.34 | 17.48 | 302.98 | 0.3465 | -639.0 | -539.0 | |
| 0 | 3 | 0 | 2 | 15.13 | 251.26 | 17.40 | 302.17 | 0.3426 | -676.0 | -731.0 | |
| 27 | -28 | 14 | -28 | 14.13 | 250.80 | 16.94 | 300.19 | 0.3282 | -1761.3 | 999999 | |
| 5 | -28 | 2 | -28 | 15.70 | 250.84 | 16.98 | 304.23 | 0.3415 | -473.5 | 999999 | |
| 9 | -28 | 5 | -28 | 14.42 | 250.40 | 16.53 | 301.54 | 0.3248 | -1520.6 | 999999 | |
| 19 | -28 | 10 | -28 | 15.07 | 250.36 | 16.50 | 303.31 | 0.3296 | -1361.9 | 999999 | |
| 7 | -28 | 4 | -28 | 15.12 | 249.85 | 15.99 | 304.23 | 0.3230 | -1416.5 | 999999 | |
| 0 | 5 | 0 | 3 | 14.25 | 249.24 | 15.37 | 302.82 | 0.3071 | -872.0 | -706.7 | |
| 0 | 4 | 0 | 2 | 13.08 | 247.52 | 13.66 | 302.23 | 0.2731 | 663.0 | 567.0 | |
| Proj. U | - Projected umbra area in millionths of solar disc, negative values indicate | |
|
that the umbra consists of fragmented regions which cannot be separated without losing umbral area. In this way several spots (intensity minima in the umbra) have a common umbra, e.g. -2 means that the given spot shares an umbra with spot No.2, and the common U value is indicated at spot No.2. |
||
| Proj. WS | - Projected whole spot area in millionths of solar disc, negative values indicate | |
|
that several umbras have a common penumbra, e.g. -7 means that the given umbra shares a penumbra with umbra No.7, and the WS value is indicated at No.7. |
||
| Corr. U | - Corrected umbra area in millionths of solar hemisphere, for negative values see above | |
| Corr. WS | - Corrected whole spot area in millionths of solar hemisphere, for negative values see above | |
| B | - Heliographic latitude B; positive: North, negative: South | |
| L | - Heliographic longitude L | |
| LCM | - Longitudinal distance from the Sun's central meridian | |
| Pos. angle | - Position angle | |
| r | - Distance from the centre of Sun's disc in terms of Sun's radius | |
| MU | - Mean magnetic field within the umbra contour averaged the pixel values with sign. | |
| MP | - Mean magnetic field within the penumbra contour averaged the pixel values with sign. | |