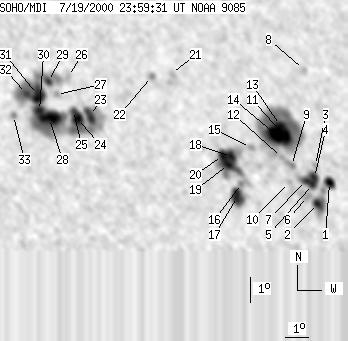
SOHO MDI 2000-07-19 23:59:31 UT
| group | Proj. U | Proj. WS | Corr. U | Corr. WS | B | L | LCM | Pos. angle | r | MU | MP |
| 217 | 1002 | 115 | 543 | 13.37 | 256.31 | 21.56 | 294.47 | 0.3930 | -380.2 | -97.1 | |
|
previous
or next observation for the same group /
back to the solar disc SOHO MDI 2000-07-19 23:59:31 UT |
| spot | Proj. U | Proj. WS | Corr. U | Corr. WS | B | L | LCM | Pos. angle | r | MU | MP |
| 8 | 25 | 4 | 14 | 11.17 | 262.80 | 28.06 | 284.52 | 0.4786 | 877.6 | 689.5 | |
| 6 | 28 | 3 | 16 | 10.36 | 262.18 | 27.43 | 283.05 | 0.4671 | 1431.1 | 897.4 | |
| 0 | 5 | 0 | 3 | 11.87 | 262.24 | 27.49 | 286.20 | 0.4724 | 496.0 | 406.3 | |
| 7 | 48 | 4 | 27 | 11.40 | 262.14 | 27.40 | 285.25 | 0.4695 | 1119.7 | 881.0 | |
| 5 | -4 | 3 | -4 | 11.13 | 262.02 | 27.28 | 284.72 | 0.4669 | 1353.3 | 999999 | |
| 0 | 16 | 0 | 9 | 10.66 | 261.75 | 27.01 | 283.83 | 0.4615 | 1004.0 | 750.2 | |
| 6 | -4 | 3 | -4 | 11.30 | 261.72 | 26.98 | 285.20 | 0.4629 | 1266.9 | 999999 | |
| 0 | 4 | 0 | 3 | 15.73 | 262.18 | 27.44 | 294.01 | 0.4875 | -761.0 | -671.0 | |
| 0 | 8 | 0 | 5 | 11.92 | 261.16 | 26.41 | 286.78 | 0.4564 | 871.0 | 703.5 | |
| 0 | 4 | 0 | 2 | 11.24 | 261.00 | 26.25 | 285.40 | 0.4518 | 548.0 | 472.8 | |
| 16 | 253 | 9 | 141 | 13.04 | 261.05 | 26.31 | 289.23 | 0.4591 | 1348.0 | 592.0 | |
| 0 | 6 | 0 | 3 | 12.25 | 260.74 | 25.99 | 287.71 | 0.4515 | 747.0 | 639.6 | |
| 6 | -11 | 3 | -11 | 13.53 | 260.84 | 26.09 | 290.38 | 0.4580 | 1206.6 | 999999 | |
| 22 | -11 | 12 | -11 | 13.18 | 260.57 | 25.83 | 289.79 | 0.4527 | 1998.2 | 999999 | |
| 0 | 6 | 0 | 3 | 12.70 | 259.40 | 24.65 | 289.45 | 0.4333 | 544.0 | 518.1 | |
| 0 | 3 | 0 | 2 | 11.28 | 258.86 | 24.11 | 286.52 | 0.4197 | -1040.0 | -945.2 | |
| 18 | 31 | 10 | 17 | 10.77 | 258.64 | 23.89 | 285.43 | 0.4145 | -1367.3 | -922.5 | |
| 10 | 90 | 5 | 49 | 12.37 | 258.52 | 23.77 | 289.24 | 0.4188 | -1027.3 | -500.7 | |
| 10 | -18 | 5 | -18 | 12.05 | 258.36 | 23.61 | 288.61 | 0.4151 | -1520.6 | 999999 | |
| 8 | -18 | 4 | -18 | 12.42 | 258.13 | 23.38 | 289.62 | 0.4132 | -1336.4 | 999999 | |
| 0 | 20 | 0 | 11 | 15.77 | 256.22 | 21.48 | 298.93 | 0.4043 | 773.0 | 657.6 | |
| 0 | 6 | 0 | 3 | 15.68 | 255.33 | 20.59 | 299.64 | 0.3912 | 959.0 | 770.0 | |
| 11 | 429 | 6 | 224 | 14.19 | 252.55 | 17.80 | 299.21 | 0.3411 | -1214.5 | -719.3 | |
| 11 | -23 | 6 | -23 | 14.08 | 251.98 | 17.24 | 299.65 | 0.3322 | -1635.3 | 999999 | |
| 3 | -23 | 2 | -23 | 14.40 | 251.84 | 17.09 | 300.72 | 0.3326 | -1043.3 | 999999 | |
| 0 | 7 | 0 | 4 | 15.77 | 251.74 | 16.99 | 304.41 | 0.3424 | 342.0 | 174.2 | |
| 0 | 6 | 0 | 3 | 15.06 | 251.16 | 16.42 | 303.43 | 0.3285 | -885.0 | -681.0 | |
| 28 | -23 | 15 | -23 | 14.11 | 250.79 | 16.05 | 301.40 | 0.3155 | -1750.7 | 999999 | |
| 5 | -23 | 2 | -23 | 15.59 | 250.87 | 16.12 | 305.28 | 0.3290 | -569.3 | 999999 | |
| 10 | -23 | 5 | -23 | 14.44 | 250.39 | 15.65 | 302.93 | 0.3126 | -1528.7 | 999999 | |
| 22 | -23 | 11 | -23 | 15.08 | 250.36 | 15.61 | 304.74 | 0.3176 | -1348.6 | 999999 | |
| 5 | -23 | 3 | -23 | 15.13 | 249.89 | 15.15 | 305.65 | 0.3118 | -1425.2 | 999999 | |
| 0 | 7 | 0 | 4 | 14.26 | 249.28 | 14.54 | 304.26 | 0.2956 | -1020.0 | -714.3 | |
| Proj. U | - Projected umbra area in millionths of solar disc, negative values indicate | |
|
that the umbra consists of fragmented regions which cannot be separated without losing umbral area. In this way several spots (intensity minima in the umbra) have a common umbra, e.g. -2 means that the given spot shares an umbra with spot No.2, and the common U value is indicated at spot No.2. |
||
| Proj. WS | - Projected whole spot area in millionths of solar disc, negative values indicate | |
|
that several umbras have a common penumbra, e.g. -7 means that the given umbra shares a penumbra with umbra No.7, and the WS value is indicated at No.7. |
||
| Corr. U | - Corrected umbra area in millionths of solar hemisphere, for negative values see above | |
| Corr. WS | - Corrected whole spot area in millionths of solar hemisphere, for negative values see above | |
| B | - Heliographic latitude B; positive: North, negative: South | |
| L | - Heliographic longitude L | |
| LCM | - Longitudinal distance from the Sun's central meridian | |
| Pos. angle | - Position angle | |
| r | - Distance from the centre of Sun's disc in terms of Sun's radius | |
| MU | - Mean magnetic field within the umbra contour averaged the pixel values with sign. | |
| MP | - Mean magnetic field within the penumbra contour averaged the pixel values with sign. | |