move the mouse pointer over that image.
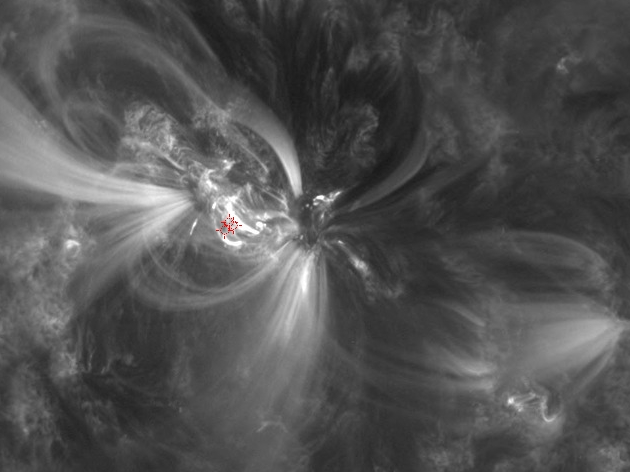
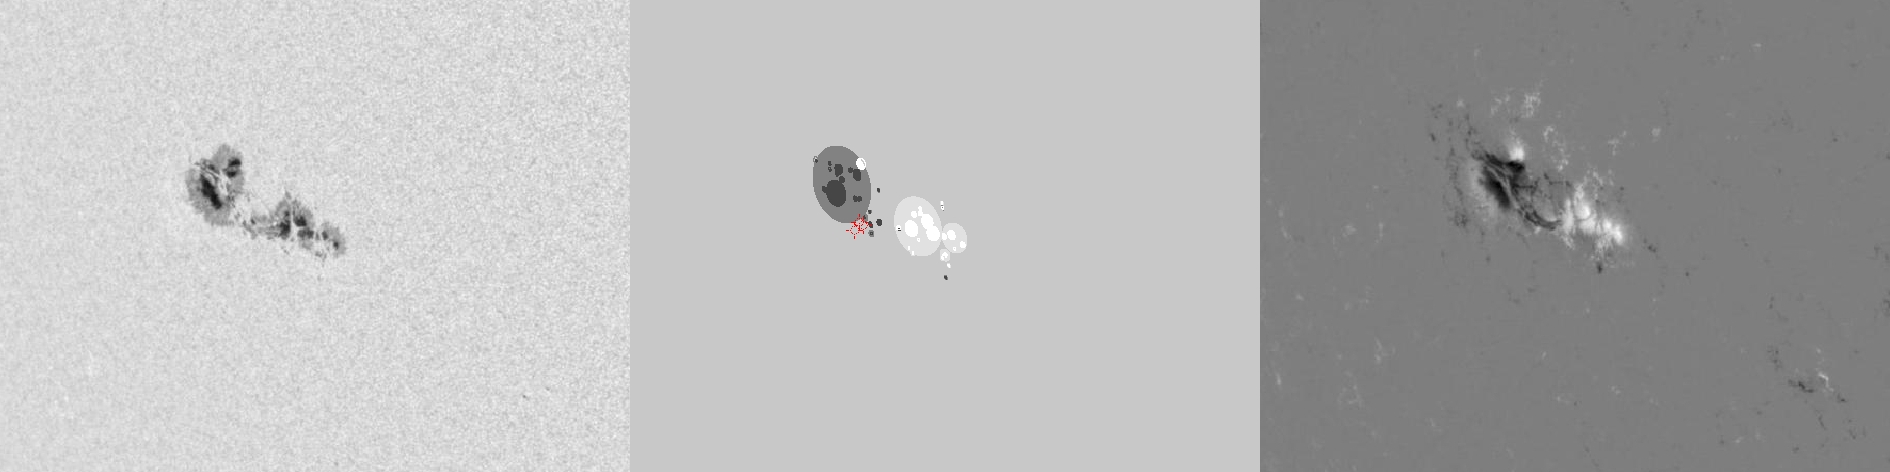
| Evolution of sunspot group NOAA 11882 and positions of flares in it animated by using the data of SDO/HMI Debrecen Data (HMIDD) sunspot catalogue (lower panel, middle, ellipses with positions and areas corresponding to the relevant data of spots in SDO and with grey-scale colour coding of the magnetic polarities corresponding to that of the magnetograms), SDO/HMI continuum images (lower panel, left) and magnetograms (lower panel, right), SDO/AIA images (upper panel, middle), GOES and RHESSI flare data (red and blue symbols) observed within the interval around the time of HMIDD data. |
|
When you want to zoom in on one of the images, simply move the mouse pointer over that image. |
 |
| Year | Month | Day | Hour | Min | Sec | NOAA | Proj.U | Proj.WS | Corr.U | Corr.WS | B | L | LCM | Pos.angle | r | MU | MP |
|---|---|---|---|---|---|---|---|---|---|---|---|---|---|---|---|---|---|
| 2013 | 10 | 27 | 11 | 58 | 59 | 11882 | 178 | 874 | 125 | 604 | -8.99 | 290.71 | -42.03 | 108.24 | 0.6983 | -49.3 | -0.6 |
| Flare | Date | Start | Peak | End | Dur [s] | Peak [c/s] | Total Counts | Energy [keV] | X pos [asec] | Y pos [asec] | Radial [asec] | B [deg] | L [deg] | Flags |
|---|---|---|---|---|---|---|---|---|---|---|---|---|---|---|
| 13102750 | 27-Oct-2013 | 11:43:04 | 11:44:30 | 11:49:12 | 368 | 26 | 32064 | 6-12 | -642 | -227 | 681 | -10.05 | 289.17 | A0 DF P1 PE |
| 13102751 | 27-Oct-2013 | 11:49:12 | 11:52:38 | 11:56:16 | 424 | 368 | 225576 | 12-25 | -635 | -224 | 674 | -9.83 | 289.71 | A0 DF DR P1 PE |
| 13102752 | 27-Oct-2013 | 11:56:16 | 11:58:42 | 12:02:52 | 396 | 108 | 149904 | 6-12 | -636 | -222 | 674 | -9.72 | 289.59 | A0 DF DR P1 PE |
| Date | Start | Peak | End | Classification | B [deg] | LCM [deg] |
|---|---|---|---|---|---|---|
| No data |

