move the mouse pointer over that image.
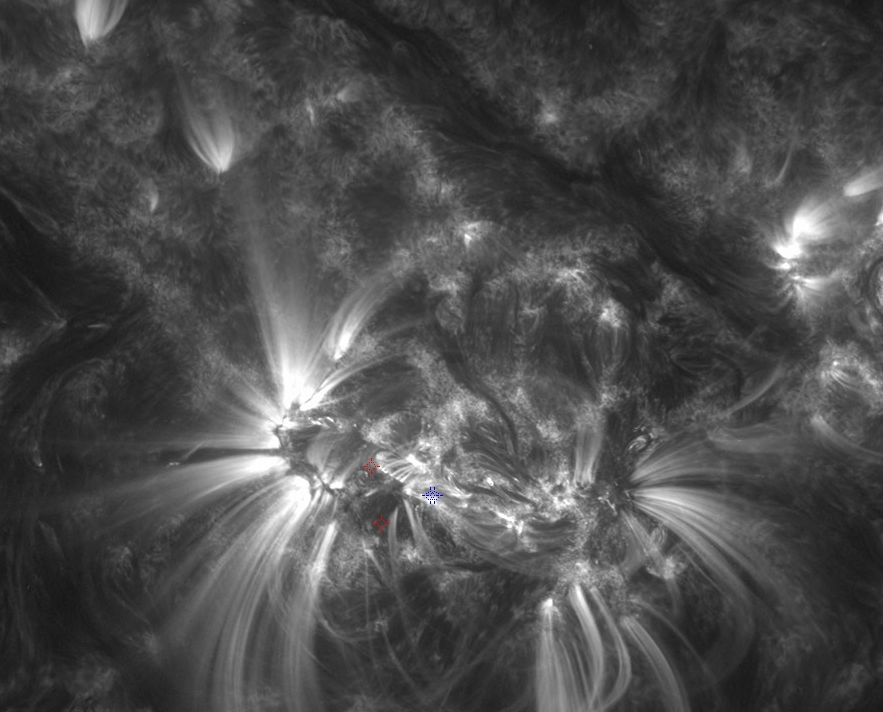
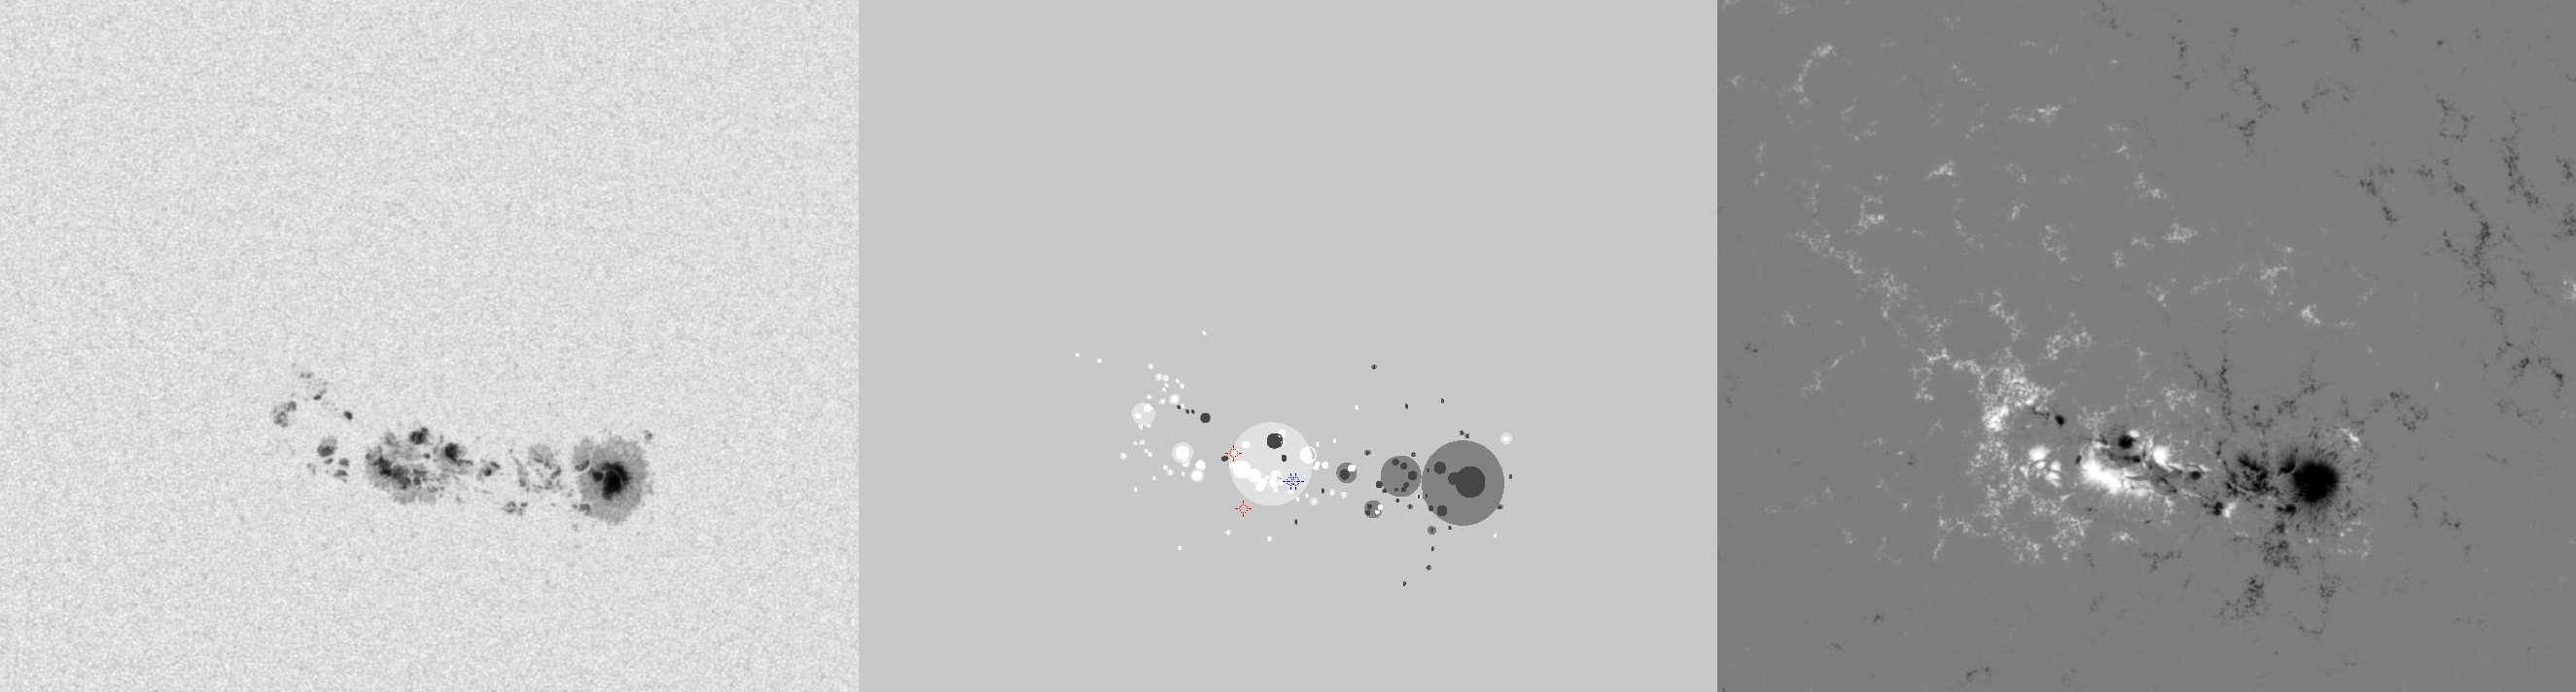
| Evolution of sunspot group NOAA 11875 and positions of flares in it animated by using the data of SDO/HMI Debrecen Data (HMIDD) sunspot catalogue (lower panel, middle, ellipses with positions and areas corresponding to the relevant data of spots in SDO and with grey-scale colour coding of the magnetic polarities corresponding to that of the magnetograms), SDO/HMI continuum images (lower panel, left) and magnetograms (lower panel, right), SDO/AIA images (upper panel, middle), GOES and RHESSI flare data (red and blue symbols) observed within the interval around the time of HMIDD data. |
|
When you want to zoom in on one of the images, simply move the mouse pointer over that image. |
 |
| Year | Month | Day | Hour | Min | Sec | NOAA | Proj.U | Proj.WS | Corr.U | Corr.WS | B | L | LCM | Pos.angle | r | MU | MP |
|---|---|---|---|---|---|---|---|---|---|---|---|---|---|---|---|---|---|
| 2013 | 10 | 24 | 04 | 58 | 60 | 11875 | 425 | 2076 | 214 | 1059 | 6.38 | 28.34 | 12.20 | 278.66 | 0.2136 | -118.2 | -74.4 |
| Flare | Date | Start | Peak | End | Dur [s] | Peak [c/s] | Total Counts | Energy [keV] | X pos [asec] | Y pos [asec] | Radial [asec] | B [deg] | L [deg] | Flags |
|---|---|---|---|---|---|---|---|---|---|---|---|---|---|---|
| 13102414 | 24-Oct-2013 | 04:34:32 | 04:37:10 | 04:42:52 | 500 | 496 | 376704 | 6-12 | 136 | 33 | 140 | 7.12 | 23.49 | A0 P1 PE |
| 13102415 | 24-Oct-2013 | 04:46:52 | 04:59:14 | 05:02:48 | 956 | 64 | 141064 | 6-12 | 149 | -3 | 149 | 4.97 | 24.04 | a0 A1 DF DR EE P1 PE |
| Date | Start | Peak | End | Classification | B [deg] | LCM [deg] |
|---|---|---|---|---|---|---|
| 24-Oct-2013 | 04:52 | 05:07 | 05:13 | C3.4 | 06 | 10 |
| 24-Oct-2013 | 05:22 | 05:27 | 05:32 | C3.0 | 06 | 10 |

