move the mouse pointer over that image.
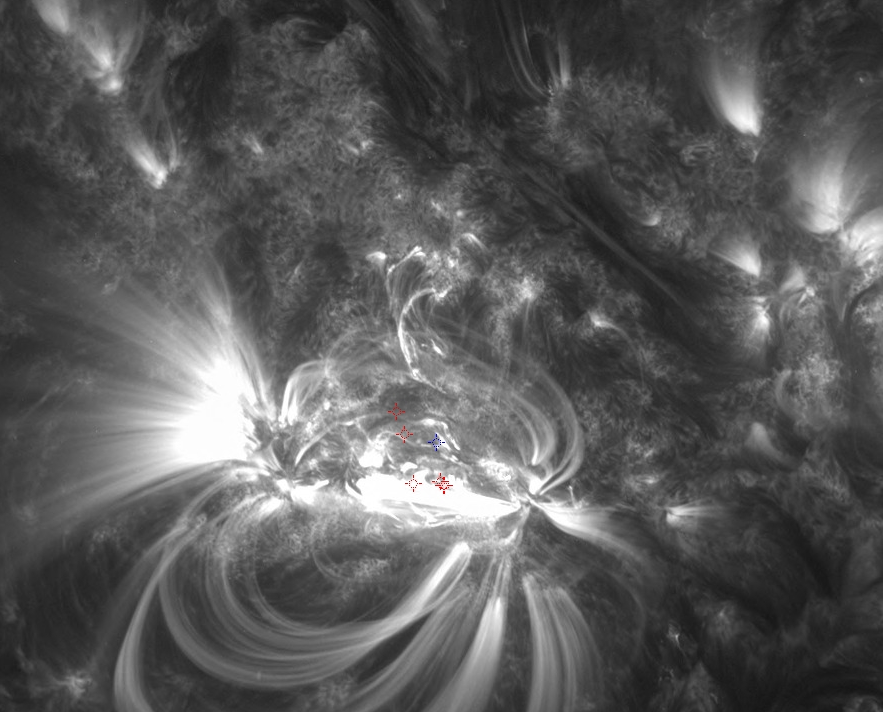
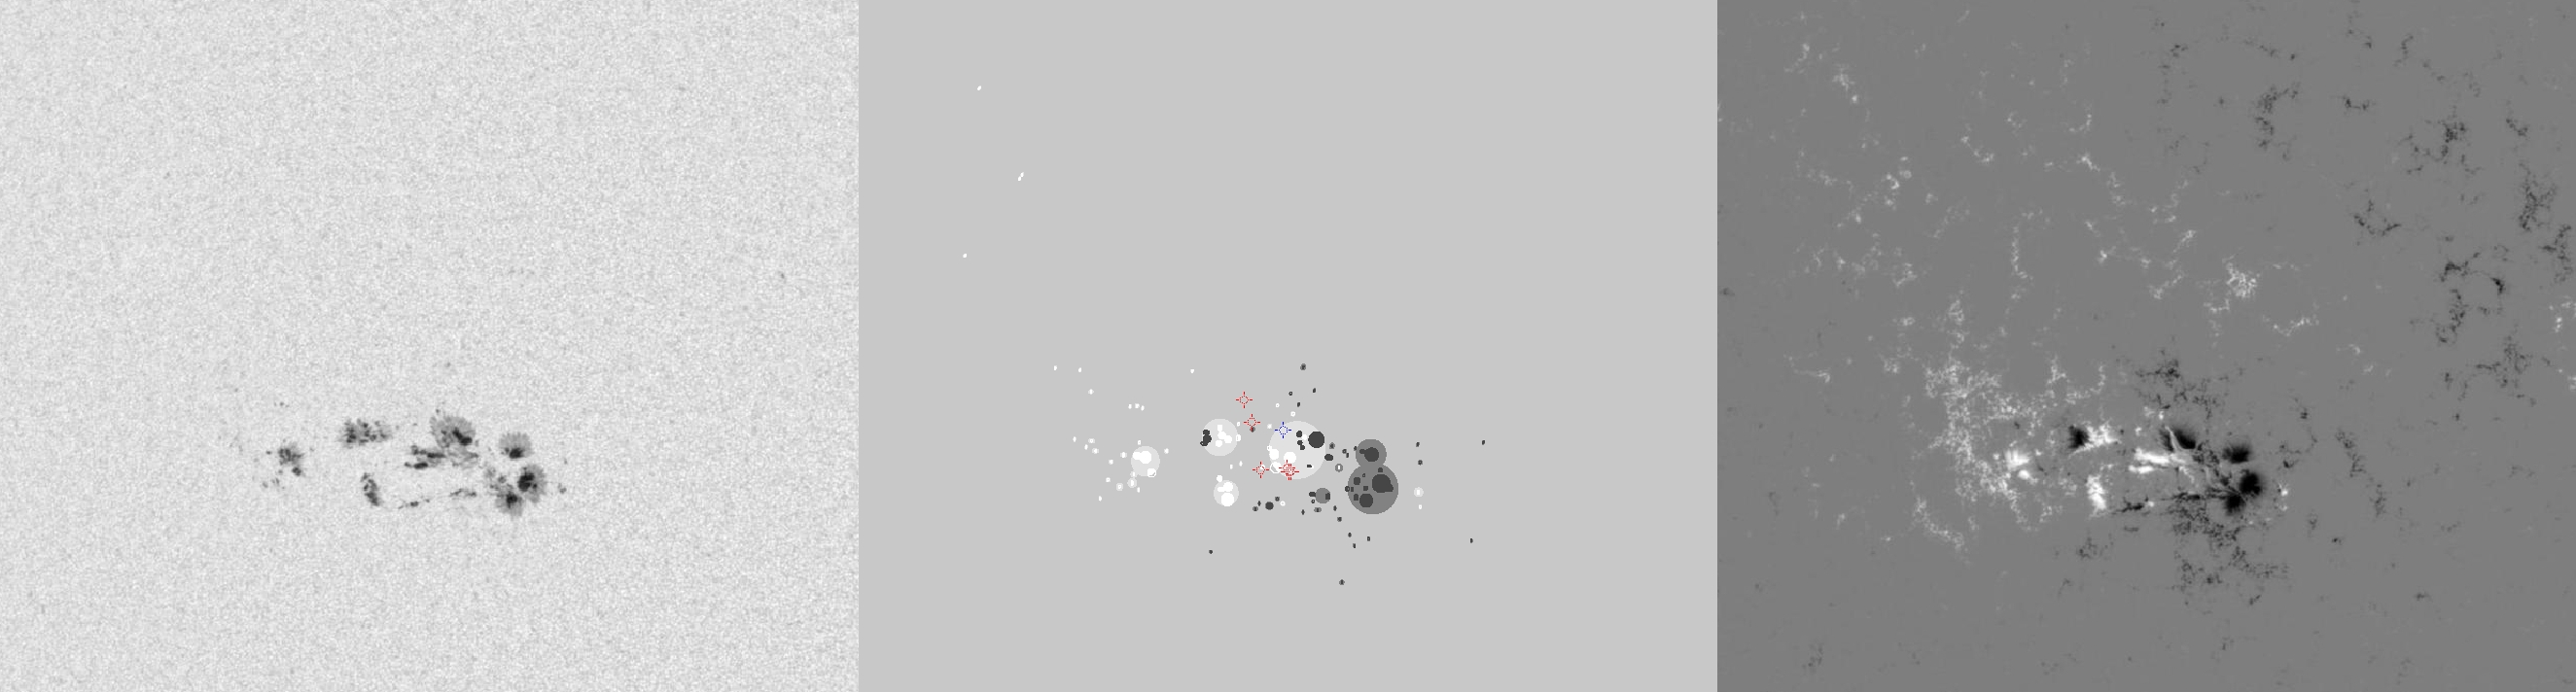
| Evolution of sunspot group NOAA 11875 and positions of flares in it animated by using the data of SDO/HMI Debrecen Data (HMIDD) sunspot catalogue (lower panel, middle, ellipses with positions and areas corresponding to the relevant data of spots in SDO and with grey-scale colour coding of the magnetic polarities corresponding to that of the magnetograms), SDO/HMI continuum images (lower panel, left) and magnetograms (lower panel, right), SDO/AIA images (upper panel, middle), GOES and RHESSI flare data (red and blue symbols) observed within the interval around the time of HMIDD data. |
|
When you want to zoom in on one of the images, simply move the mouse pointer over that image. |
 |
| Year | Month | Day | Hour | Min | Sec | NOAA | Proj.U | Proj.WS | Corr.U | Corr.WS | B | L | LCM | Pos.angle | r | MU | MP |
|---|---|---|---|---|---|---|---|---|---|---|---|---|---|---|---|---|---|
| 2013 | 10 | 22 | 04 | 59 | 00 | 11875 | 286 | 1188 | 148 | 617 | 6.75 | 27.90 | -14.61 | 83.64 | 0.2534 | -145.3 | -52.9 |
| Flare | Date | Start | Peak | End | Dur [s] | Peak [c/s] | Total Counts | Energy [keV] | X pos [asec] | Y pos [asec] | Radial [asec] | B [deg] | L [deg] | Flags |
|---|---|---|---|---|---|---|---|---|---|---|---|---|---|---|
| 13102217 | 22-Oct-2013 | 04:34:44 | 04:35:14 | 04:35:32 | 48 | 68 | 15360 | 6-12 | -250 | 21 | 251 | 6.45 | 26.57 | A0 P1 PE |
| 13102218 | 22-Oct-2013 | 04:38:12 | 04:43:46 | 04:51:04 | 772 | 2544 | 1560240 | 12-25 | -253 | 52 | 259 | 8.29 | 26.24 | A0 P1 PE |
| 13102222 | 22-Oct-2013 | 04:58:20 | 04:59:54 | 05:02:04 | 224 | 76 | 66720 | 6-12 | -223 | 20 | 224 | 6.42 | 28.01 | A0 P1 PE |
| 13102223 | 22-Oct-2013 | 05:03:04 | 05:03:34 | 05:04:24 | 80 | 48 | 18720 | 6-12 | -223 | 20 | 224 | 6.42 | 27.98 | A0 P1 PE |
| 13102224 | 22-Oct-2013 | 05:06:48 | 05:07:58 | 05:11:00 | 252 | 84 | 79392 | 6-12 | -223 | 22 | 224 | 6.54 | 27.93 | A0 P1 PE |
| 13102225 | 22-Oct-2013 | 05:20:48 | 05:21:30 | 05:22:00 | 72 | 28 | 9432 | 6-12 | -247 | 66 | 256 | 9.13 | 26.23 | A0 DR P1 PE |
| Date | Start | Peak | End | Classification | B [deg] | LCM [deg] |
|---|---|---|---|---|---|---|
| 22-Oct-2013 | 04:40 | 04:44 | 04:46 | C2.1 | 08 | -15 |

