move the mouse pointer over that image.
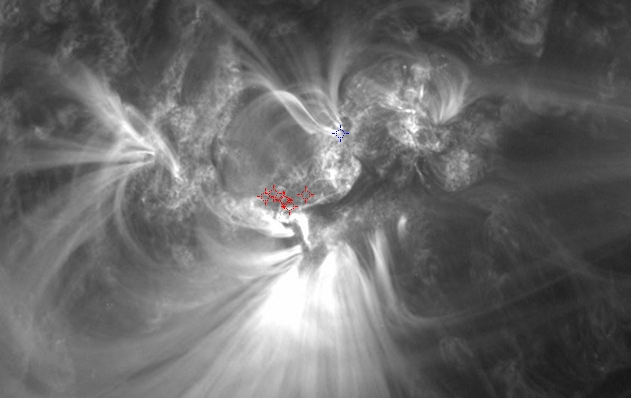
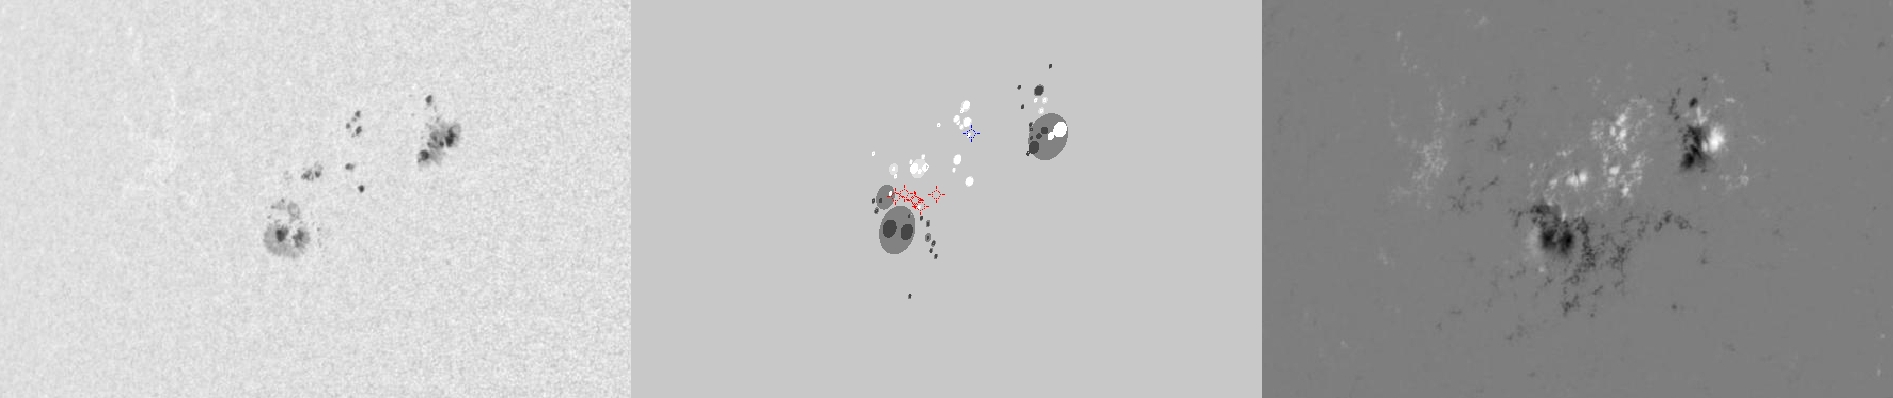
| Evolution of sunspot group NOAA 11748 and positions of flares in it animated by using the data of SDO/HMI Debrecen Data (HMIDD) sunspot catalogue (lower panel, middle, ellipses with positions and areas corresponding to the relevant data of spots in SDO and with grey-scale colour coding of the magnetic polarities corresponding to that of the magnetograms), SDO/HMI continuum images (lower panel, left) and magnetograms (lower panel, right), SDO/AIA images (upper panel, middle), GOES and RHESSI flare data (red and blue symbols) observed within the interval around the time of HMIDD data. |
|
When you want to zoom in on one of the images, simply move the mouse pointer over that image. |
 |
| Year | Month | Day | Hour | Min | Sec | NOAA | Proj.U | Proj.WS | Corr.U | Corr.WS | B | L | LCM | Pos.angle | r | MU | MP |
|---|---|---|---|---|---|---|---|---|---|---|---|---|---|---|---|---|---|
| 2013 | 05 | 16 | 18 | 59 | 08 | 11748 | 125 | 529 | 88 | 367 | 11.24 | 295.13 | -41.47 | 70.60 | 0.6903 | -79.9 | -125.4 |
| Flare | Date | Start | Peak | End | Dur [s] | Peak [c/s] | Total Counts | Energy [keV] | X pos [asec] | Y pos [asec] | Radial [asec] | B [deg] | L [deg] | Flags |
|---|---|---|---|---|---|---|---|---|---|---|---|---|---|---|
| 13051629 | 16-May-2013 | 18:33:32 | 18:34:10 | 18:45:56 | 744 | 14 | 12354 | 12-25 | -646 | 206 | 678 | 10.49 | 292.77 | A0 DR ES P1 PE |
| 13051630 | 16-May-2013 | 18:45:56 | 18:47:22 | 18:49:56 | 240 | 1 | 655 | 6-12 | -630 | 210 | 665 | 10.69 | 293.93 | A0 P1 PE |
| 13051631 | 16-May-2013 | 18:53:16 | 18:54:38 | 18:58:48 | 332 | 1 | 1164 | 6-12 | -654 | 209 | 686 | 10.69 | 291.87 | A0 P1 PE |
| 13051632 | 16-May-2013 | 18:58:48 | 19:04:26 | 19:09:52 | 664 | 3 | 4867 | 6-12 | -640 | 207 | 673 | 10.53 | 292.98 | A0 DR P1 PE |
| 13051633 | 16-May-2013 | 19:09:52 | 19:11:50 | 19:14:48 | 296 | 1 | 890 | 6-12 | -645 | 211 | 679 | 10.79 | 292.45 | A0 DR P1 PE |
| 13051634 | 16-May-2013 | 19:14:48 | 19:22:26 | 19:33:00 | 1092 | 288 | 356874 | 12-25 | -632 | 203 | 664 | 10.27 | 293.51 | a0 A1 DR P1 PE |
| Date | Start | Peak | End | Classification | B [deg] | LCM [deg] |
|---|---|---|---|---|---|---|
| 16-May-2013 | 19:17 | 19:24 | 19:30 | C4.8 | 13 | -41 |

