move the mouse pointer over that image.
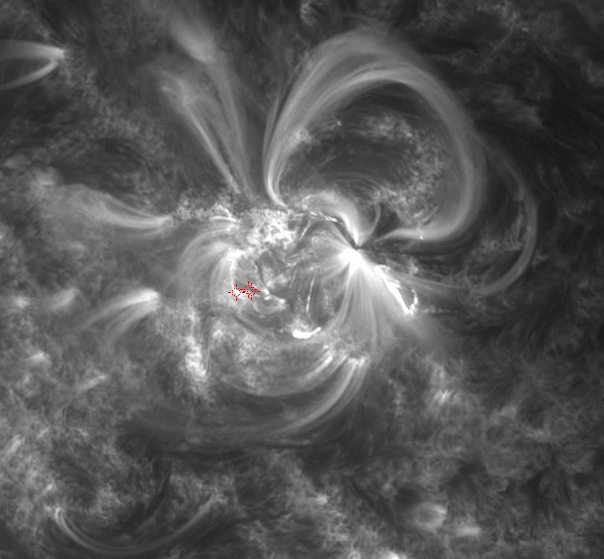
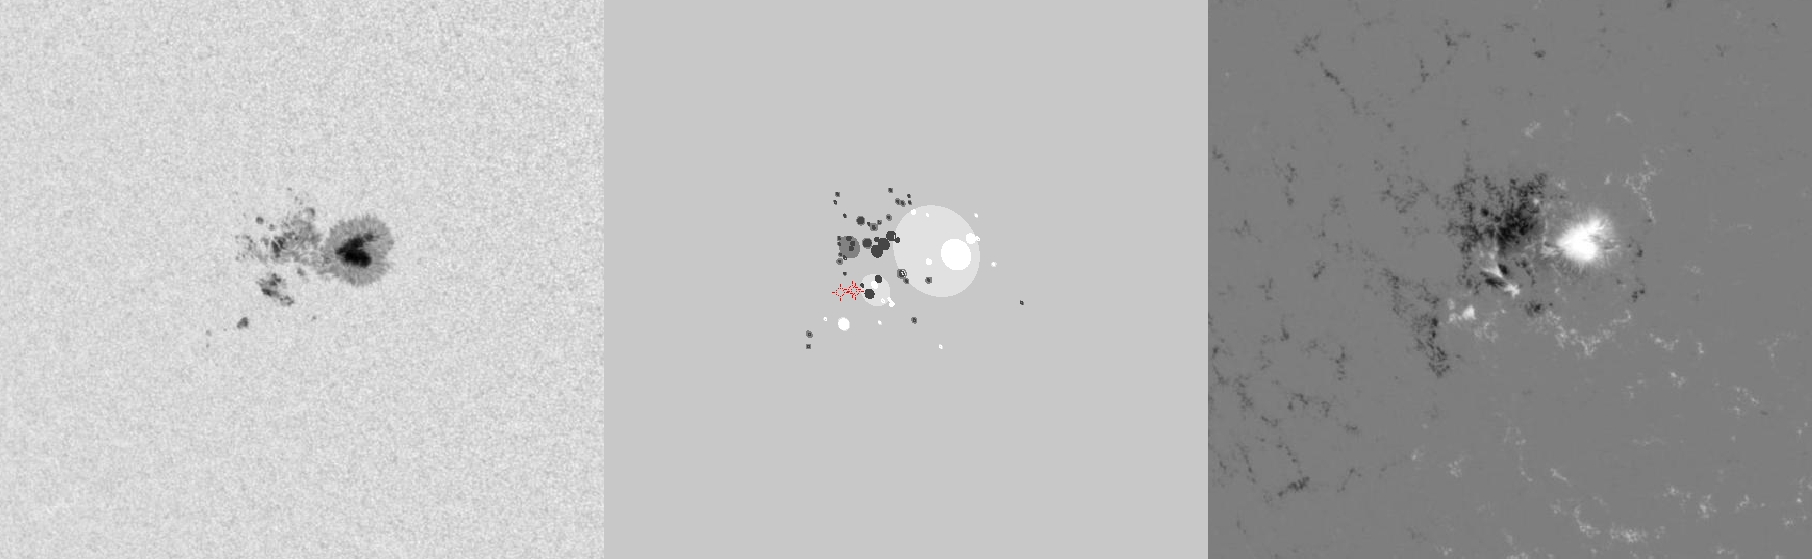
| Evolution of sunspot group NOAA 11598 and positions of flares in it animated by using the data of SDO/HMI Debrecen Data (HMIDD) sunspot catalogue (lower panel, middle, ellipses with positions and areas corresponding to the relevant data of spots in SDO and with grey-scale colour coding of the magnetic polarities corresponding to that of the magnetograms), SDO/HMI continuum images (lower panel, left) and magnetograms (lower panel, right), SDO/AIA images (upper panel, middle), GOES and RHESSI flare data (red and blue symbols) observed within the interval around the time of HMIDD data. |
|
When you want to zoom in on one of the images, simply move the mouse pointer over that image. |
 |
| Year | Month | Day | Hour | Min | Sec | NOAA | Proj.U | Proj.WS | Corr.U | Corr.WS | B | L | LCM | Pos.angle | r | MU | MP |
|---|---|---|---|---|---|---|---|---|---|---|---|---|---|---|---|---|---|
| 2012 | 10 | 25 | 06 | 58 | 60 | 11598 | 202 | 1057 | 118 | 613 | -11.64 | 112.92 | -26.49 | 122.46 | 0.5195 | 385.8 | 13.5 |
| Flare | Date | Start | Peak | End | Dur [s] | Peak [c/s] | Total Counts | Energy [keV] | X pos [asec] | Y pos [asec] | Radial [asec] | B [deg] | L [deg] | Flags |
|---|---|---|---|---|---|---|---|---|---|---|---|---|---|---|
| 12102510 | 25-Oct-2012 | 06:30:08 | 06:31:06 | 06:32:28 | 140 | 24 | 14304 | 6-12 | -456 | -291 | 541 | -13.16 | 109.53 | A0 DF P1 PE |
| 12102511 | 25-Oct-2012 | 06:45:24 | 06:47:38 | 06:48:56 | 212 | 32 | 32064 | 6-12 | -450 | -292 | 536 | -13.21 | 109.79 | A0 DF P1 PE |
| 12102512 | 25-Oct-2012 | 06:59:28 | 07:05:14 | 07:06:04 | 396 | 421 | 436174 | 12-25 | -455 | -293 | 541 | -13.29 | 109.27 | A0 DF P1 PE |
| Date | Start | Peak | End | Classification | B [deg] | LCM [deg] |
|---|---|---|---|---|---|---|
| No data |

