move the mouse pointer over that image.
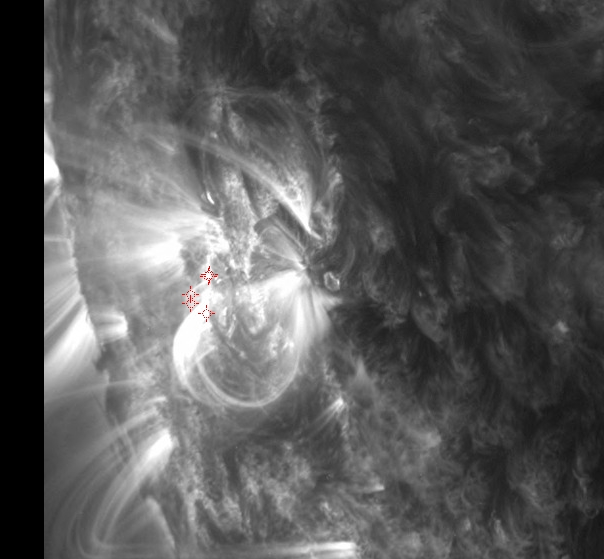
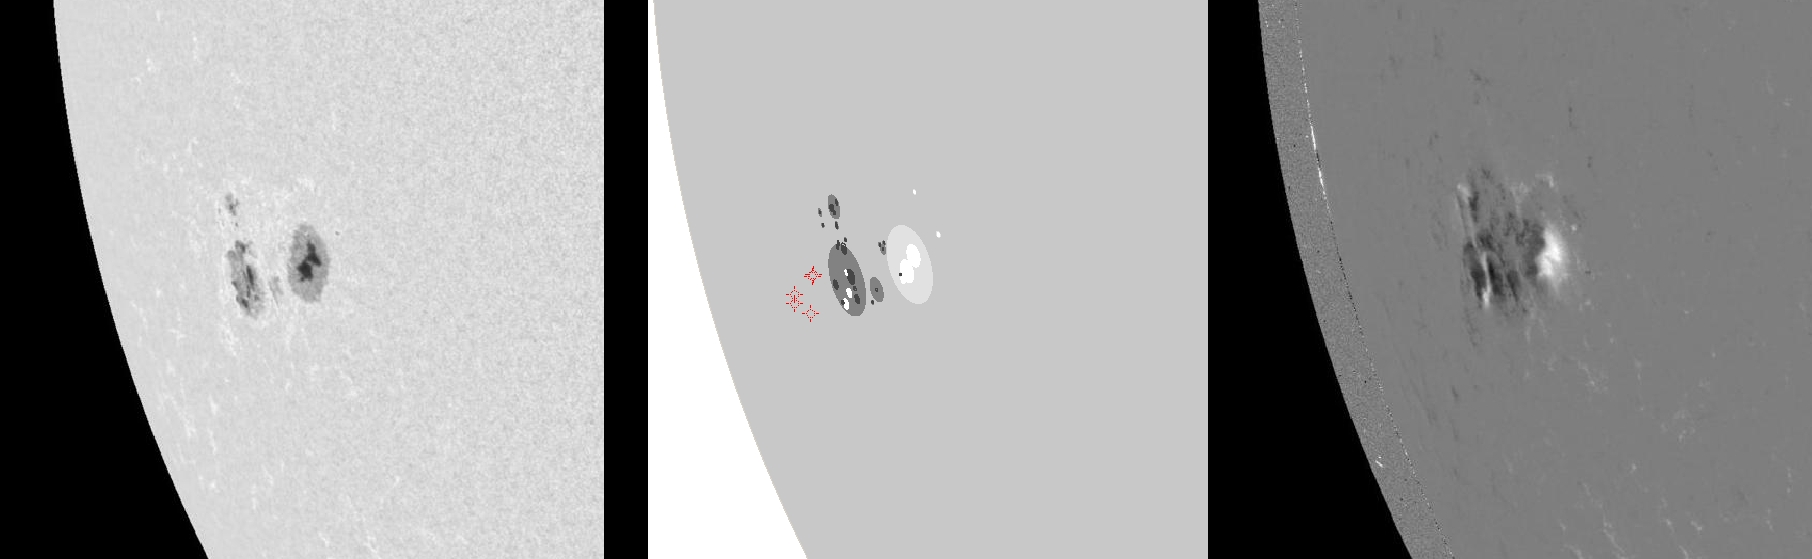
| Evolution of sunspot group NOAA 11598 and positions of flares in it animated by using the data of SDO/HMI Debrecen Data (HMIDD) sunspot catalogue (lower panel, middle, ellipses with positions and areas corresponding to the relevant data of spots in SDO and with grey-scale colour coding of the magnetic polarities corresponding to that of the magnetograms), SDO/HMI continuum images (lower panel, left) and magnetograms (lower panel, right), SDO/AIA images (upper panel, middle), GOES and RHESSI flare data (red and blue symbols) observed within the interval around the time of HMIDD data. |
|
When you want to zoom in on one of the images, simply move the mouse pointer over that image. |
 |
| Year | Month | Day | Hour | Min | Sec | NOAA | Proj.U | Proj.WS | Corr.U | Corr.WS | B | L | LCM | Pos.angle | r | MU | MP |
|---|---|---|---|---|---|---|---|---|---|---|---|---|---|---|---|---|---|
| 2012 | 10 | 22 | 17 | 58 | 60 | 11598 | 107 | 666 | 116 | 718 | -12.19 | 112.61 | -60.34 | 106.69 | 0.8877 | 259.2 | -112.5 |
| Flare | Date | Start | Peak | End | Dur [s] | Peak [c/s] | Total Counts | Energy [keV] | X pos [asec] | Y pos [asec] | Radial [asec] | B [deg] | L [deg] | Flags |
|---|---|---|---|---|---|---|---|---|---|---|---|---|---|---|
| 12102233 | 22-Oct-2012 | 17:50:00 | 17:52:26 | 17:57:20 | 440 | 112 | 153864 | 6-12 | -860 | -263 | 900 | -13.89 | 104.70 | A0 DF P1 PE |
| 12102234 | 22-Oct-2012 | 17:57:20 | 17:59:42 | 18:10:24 | 784 | 80 | 147288 | 6-12 | -849 | -275 | 892 | -14.52 | 105.98 | A0 DF DR P1 PE |
| 12102235 | 22-Oct-2012 | 18:10:24 | 18:11:10 | 18:12:36 | 132 | 16 | 10800 | 6-12 | -858 | -269 | 900 | -14.26 | 104.63 | A0 DF DR P1 PE |
| 12102236 | 22-Oct-2012 | 18:12:36 | 18:16:58 | 18:20:20 | 464 | 44 | 69120 | 6-12 | -845 | -251 | 881 | -12.90 | 107.28 | A0 DF DR P1 PE |
| 12102237 | 22-Oct-2012 | 18:20:20 | 18:21:58 | 18:26:00 | 340 | 38 | 51168 | 6-12 | -845 | -252 | 882 | -12.97 | 107.20 | A0 DF DR P1 PE |
| Date | Start | Peak | End | Classification | B [deg] | LCM [deg] |
|---|---|---|---|---|---|---|
| No data |

