
move the mouse pointer over that image.
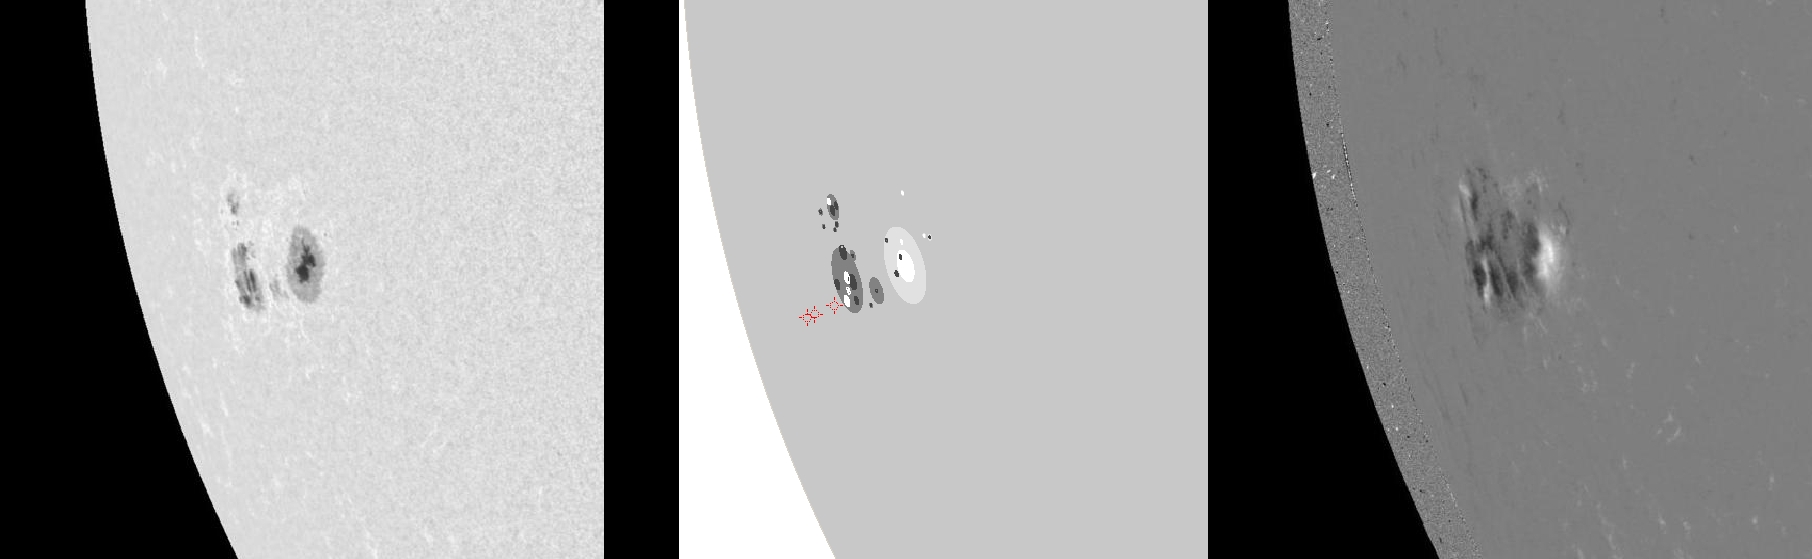
| Evolution of sunspot group NOAA 11598 and positions of flares in it animated by using the data of SDO/HMI Debrecen Data (HMIDD) sunspot catalogue (lower panel, middle, ellipses with positions and areas corresponding to the relevant data of spots in SDO and with grey-scale colour coding of the magnetic polarities corresponding to that of the magnetograms), SDO/HMI continuum images (lower panel, left) and magnetograms (lower panel, right), SDO/AIA images (upper panel, middle), GOES and RHESSI flare data (red and blue symbols) observed within the interval around the time of HMIDD data. |
|
When you want to zoom in on one of the images, simply move the mouse pointer over that image. |
 |
| Year | Month | Day | Hour | Min | Sec | NOAA | Proj.U | Proj.WS | Corr.U | Corr.WS | B | L | LCM | Pos.angle | r | MU | MP |
|---|---|---|---|---|---|---|---|---|---|---|---|---|---|---|---|---|---|
| 2012 | 10 | 22 | 12 | 58 | 59 | 11598 | 107 | 567 | 126 | 664 | -12.15 | 112.80 | -62.90 | 106.06 | 0.9064 | 149.2 | -114.1 |
| Flare | Date | Start | Peak | End | Dur [s] | Peak [c/s] | Total Counts | Energy [keV] | X pos [asec] | Y pos [asec] | Radial [asec] | B [deg] | L [deg] | Flags |
|---|---|---|---|---|---|---|---|---|---|---|---|---|---|---|
| 12102218 | 22-Oct-2012 | 12:46:44 | 12:48:58 | 12:53:48 | 424 | 30 | 34608 | 6-12 | -855 | -266 | 895 | -14.01 | 108.20 | A0 DF P1 PE |
| 12102219 | 22-Oct-2012 | 12:53:48 | 13:01:10 | 13:01:12 | 444 | 24 | 29760 | 6-12 | -871 | -274 | 913 | -14.79 | 104.91 | A0 DF P1 PE Q3 |
| 12102220 | 22-Oct-2012 | 13:10:52 | 13:11:06 | 13:28:52 | 1080 | 496 | 578472 | 12-25 | -865 | -272 | 907 | -14.56 | 106.03 | A0 DF DR GS P1 PE |
| Date | Start | Peak | End | Classification | B [deg] | LCM [deg] |
|---|---|---|---|---|---|---|
| No data |

