move the mouse pointer over that image.
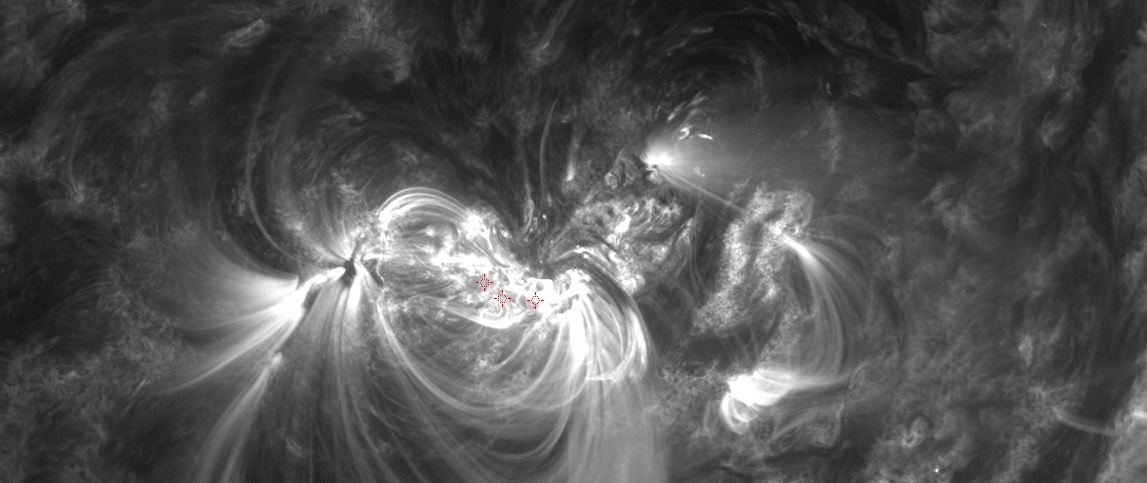
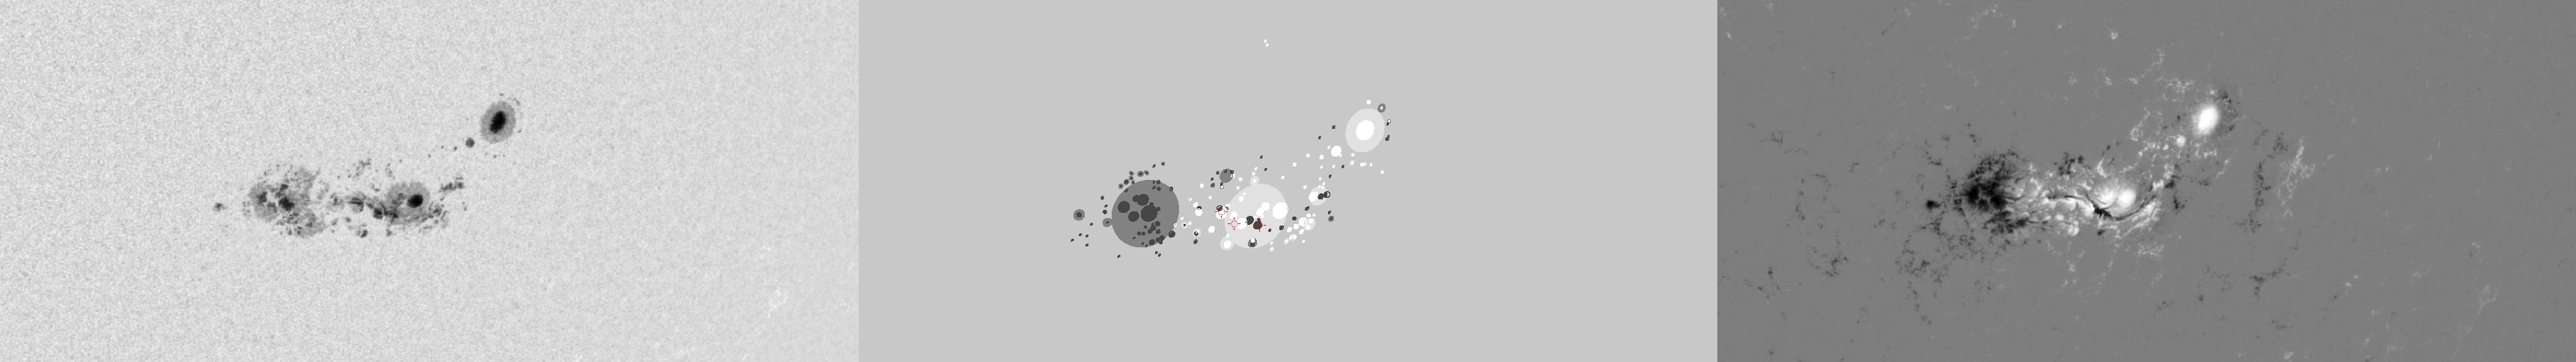
| Evolution of sunspot group NOAA 11515 and positions of flares in it animated by using the data of SDO/HMI Debrecen Data (HMIDD) sunspot catalogue (lower panel, middle, ellipses with positions and areas corresponding to the relevant data of spots in SDO and with grey-scale colour coding of the magnetic polarities corresponding to that of the magnetograms), SDO/HMI continuum images (lower panel, left) and magnetograms (lower panel, right), SDO/AIA images (upper panel, middle), GOES and RHESSI flare data (red and blue symbols) observed within the interval around the time of HMIDD data. |
|
When you want to zoom in on one of the images, simply move the mouse pointer over that image. |
 |
| Year | Month | Day | Hour | Min | Sec | NOAA | Proj.U | Proj.WS | Corr.U | Corr.WS | B | L | LCM | Pos.angle | r | MU | MP |
|---|---|---|---|---|---|---|---|---|---|---|---|---|---|---|---|---|---|
| 2012 | 07 | 05 | 02 | 59 | 11 | 11515 | 540 | 2310 | 323 | 1368 | -16.66 | 206.88 | 25.64 | 230.34 | 0.5386 | 164.3 | 108.6 |
| Flare | Date | Start | Peak | End | Dur [s] | Peak [c/s] | Total Counts | Energy [keV] | X pos [asec] | Y pos [asec] | Radial [asec] | B [deg] | L [deg] | Flags |
|---|---|---|---|---|---|---|---|---|---|---|---|---|---|---|
| 12070507 | 5-Jul-2012 | 03:02:28 | 03:03:30 | 03:05:12 | 164 | 68 | 52679 | 12-25 | 436 | -345 | 556 | -18.16 | 208.70 | a0 A1 DF DR P1 PE |
| 12070580 | 5-Jul-2012 | 03:05:12 | 03:06:18 | 03:08:52 | 220 | 68 | 67604 | 6-12 | 416 | -344 | 540 | -18.06 | 207.24 | a0 A1 DF DR P1 PE |
| 12070581 | 5-Jul-2012 | 03:15:44 | 03:16:30 | 03:18:04 | 140 | 30 | 20727 | 12-25 | 408 | -334 | 527 | -17.40 | 206.48 | a0 A1 DF P1 PE |
| Date | Start | Peak | End | Classification | B [deg] | LCM [deg] |
|---|---|---|---|---|---|---|
| No data |

