move the mouse pointer over that image.
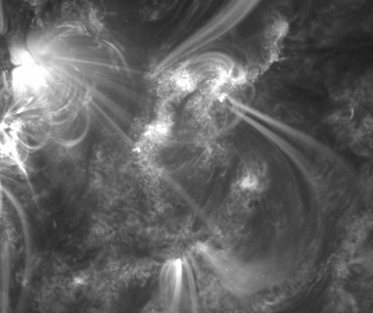
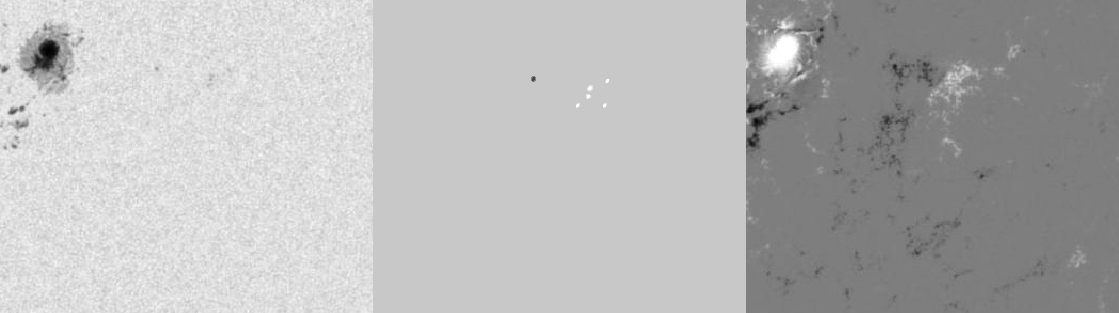
| Evolution of sunspot group NOAA 11514 and positions of flares in it animated by using the data of SDO/HMI Debrecen Data (HMIDD) sunspot catalogue (lower panel, middle, ellipses with positions and areas corresponding to the relevant data of spots in SDO and with grey-scale colour coding of the magnetic polarities corresponding to that of the magnetograms), SDO/HMI continuum images (lower panel, left) and magnetograms (lower panel, right), SDO/AIA images (upper panel, middle), GOES and RHESSI flare data (red and blue symbols) observed within the interval around the time of HMIDD data. |
|
When you want to zoom in on one of the images, simply move the mouse pointer over that image. |
 |
| Year | Month | Day | Hour | Min | Sec | NOAA | Proj.U | Proj.WS | Corr.U | Corr.WS | B | L | LCM | Pos.angle | r | MU | MP |
|---|---|---|---|---|---|---|---|---|---|---|---|---|---|---|---|---|---|
| 2012 | 07 | 03 | 22 | 59 | 11 | 11514 | 0 | 10 | 0 | 7 | -15.35 | 219.61 | 22.93 | 230.07 | 0.4917 | 392.5 | 392.4 |
| Flare | Date | Start | Peak | End | Dur [s] | Peak [c/s] | Total Counts | Energy [keV] | X pos [asec] | Y pos [asec] | Radial [asec] | B [deg] | L [deg] | Flags |
|---|---|---|---|---|---|---|---|---|---|---|---|---|---|---|
| 12070394 | 3-Jul-2012 | 22:28:16 | 22:31:34 | 22:44:32 | 976 | 256 | 785808 | 12-25 | 230 | -327 | 400 | -16.84 | 210.41 | A0 DF DR P1 PE |
| 12070369 | 3-Jul-2012 | 22:44:32 | 22:46:30 | 22:49:52 | 320 | 96 | 102576 | 6-12 | 209 | -345 | 404 | -17.96 | 209.01 | A0 DF P1 PE |
| 12070370 | 3-Jul-2012 | 22:49:52 | 22:52:54 | 22:59:52 | 600 | 136 | 293856 | 6-12 | 217 | -340 | 404 | -17.65 | 209.44 | A0 DF DR P1 PE |
| Date | Start | Peak | End | Classification | B [deg] | LCM [deg] |
|---|---|---|---|---|---|---|
| No data |

