move the mouse pointer over that image.
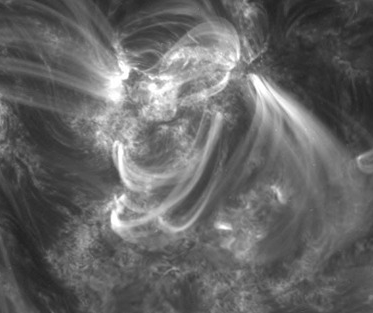
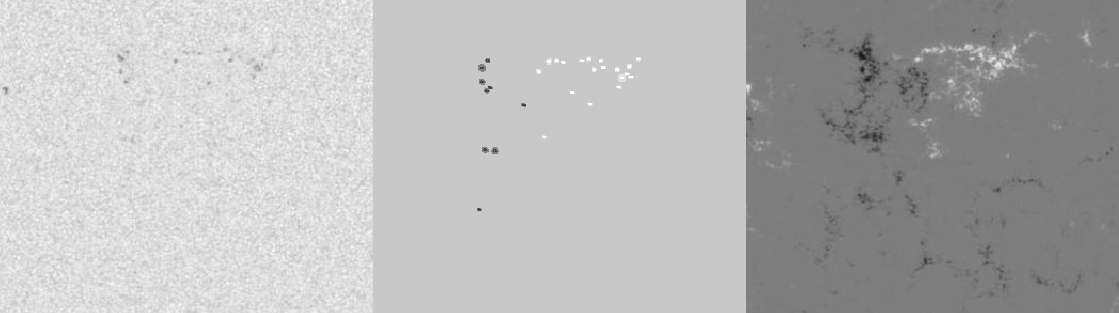
| Evolution of sunspot group NOAA 11514 and positions of flares in it animated by using the data of SDO/HMI Debrecen Data (HMIDD) sunspot catalogue (lower panel, middle, ellipses with positions and areas corresponding to the relevant data of spots in SDO and with grey-scale colour coding of the magnetic polarities corresponding to that of the magnetograms), SDO/HMI continuum images (lower panel, left) and magnetograms (lower panel, right), SDO/AIA images (upper panel, middle), GOES and RHESSI flare data (red and blue symbols) observed within the interval around the time of HMIDD data. |
|
When you want to zoom in on one of the images, simply move the mouse pointer over that image. |
 |
| Year | Month | Day | Hour | Min | Sec | NOAA | Proj.U | Proj.WS | Corr.U | Corr.WS | B | L | LCM | Pos.angle | r | MU | MP |
|---|---|---|---|---|---|---|---|---|---|---|---|---|---|---|---|---|---|
| 2012 | 07 | 01 | 20 | 59 | 11 | 11514 | 0 | 55 | 0 | 34 | -15.27 | 219.10 | -5.16 | 164.85 | 0.3279 | 312.8 | 128.7 |
| Flare | Date | Start | Peak | End | Dur [s] | Peak [c/s] | Total Counts | Energy [keV] | X pos [asec] | Y pos [asec] | Radial [asec] | B [deg] | L [deg] | Flags |
|---|---|---|---|---|---|---|---|---|---|---|---|---|---|---|
| 12070158 | 1-Jul-2012 | 20:53:40 | 20:54:54 | 20:57:16 | 216 | 26 | 27648 | 6-12 | -304 | -336 | 454 | -17.70 | 203.97 | A0 DF DR P1 PE |
| 12070195 | 1-Jul-2012 | 20:57:16 | 21:01:22 | 21:07:52 | 636 | 128 | 102408 | 6-12 | -307 | -323 | 446 | -16.88 | 203.80 | A0 DF DR P1 PE |
| 12070163 | 1-Jul-2012 | 21:12:28 | 21:14:46 | 21:15:48 | 200 | 42 | 35880 | 6-12 | -312 | -330 | 454 | -17.33 | 203.30 | A0 DF P1 PE |
| 12070196 | 1-Jul-2012 | 21:15:48 | 21:17:22 | 21:19:56 | 248 | 68 | 44376 | 6-12 | -302 | -324 | 443 | -16.94 | 203.98 | A0 DF P1 PE |
| 12070164 | 1-Jul-2012 | 21:19:56 | 21:21:54 | 21:24:32 | 276 | 26 | 30024 | 6-12 | -294 | -328 | 441 | -17.18 | 204.44 | A0 DF P1 PE |
| 12070159 | 1-Jul-2012 | 21:26:52 | 21:28:10 | 21:32:24 | 332 | 128 | 116400 | 12-25 | -313 | -321 | 448 | -16.76 | 203.17 | A0 DF DR P1 PE |
| Date | Start | Peak | End | Classification | B [deg] | LCM [deg] |
|---|---|---|---|---|---|---|
| No data |

