move the mouse pointer over that image.
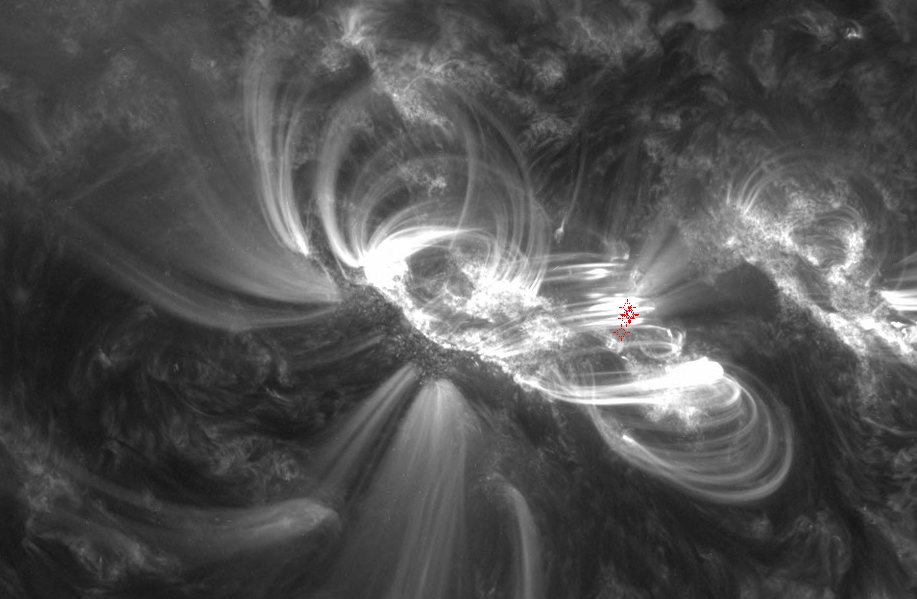
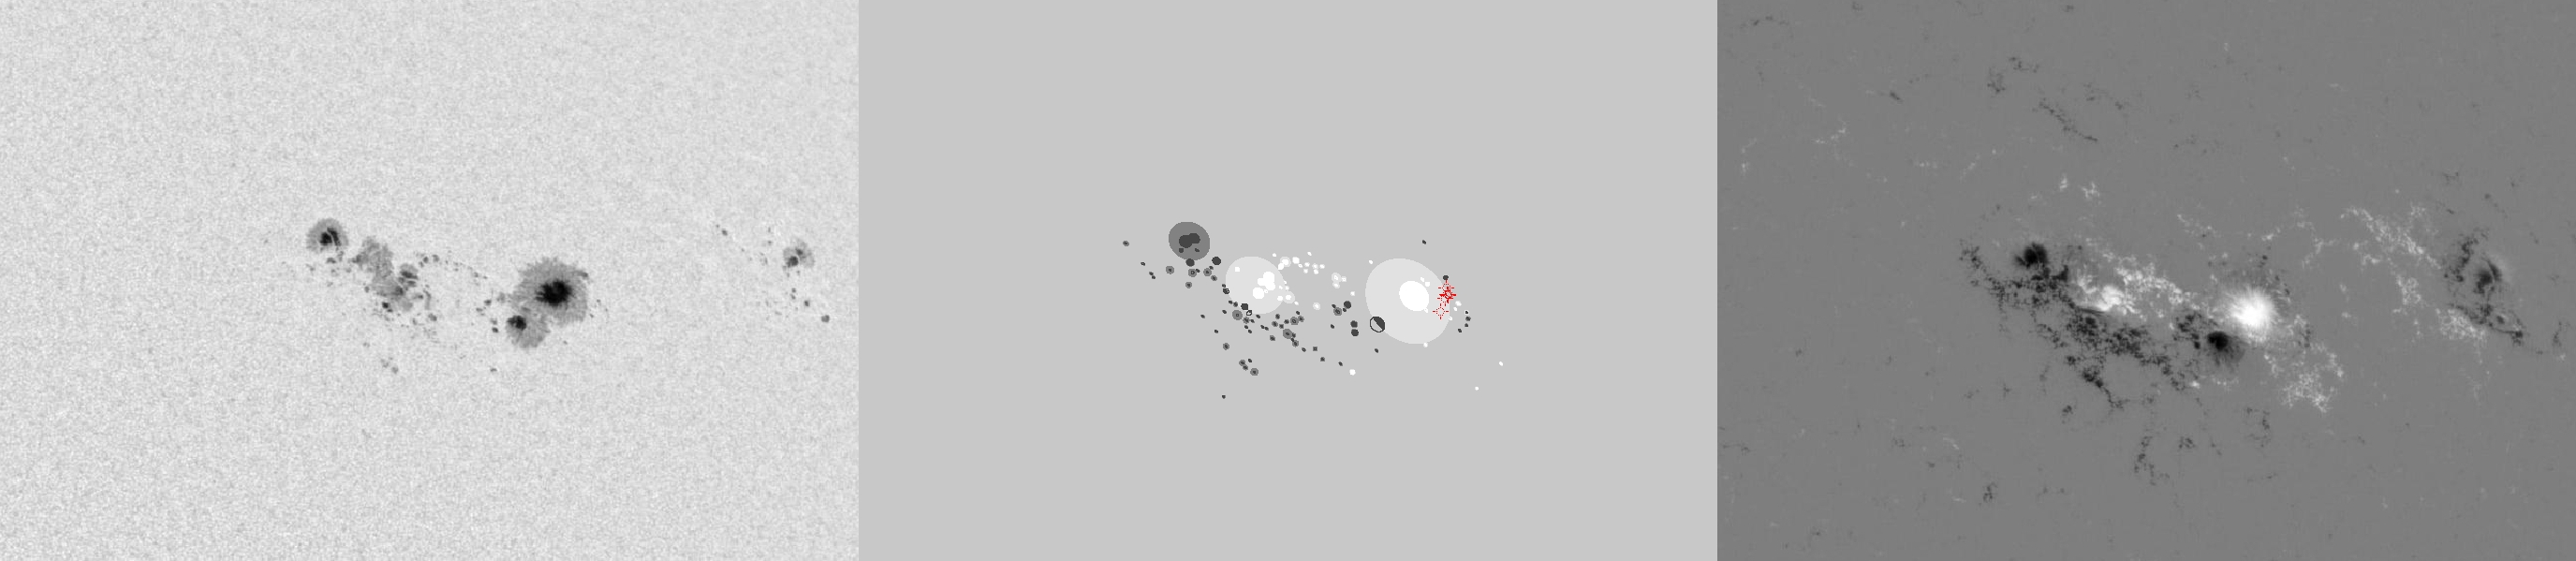
| Evolution of sunspot group NOAA 11429 and positions of flares in it animated by using the data of SDO/HMI Debrecen Data (HMIDD) sunspot catalogue (lower panel, middle, ellipses with positions and areas corresponding to the relevant data of spots in SDO and with grey-scale colour coding of the magnetic polarities corresponding to that of the magnetograms), SDO/HMI continuum images (lower panel, left) and magnetograms (lower panel, right), SDO/AIA images (upper panel, middle), GOES and RHESSI flare data (red and blue symbols) observed within the interval around the time of HMIDD data. |
|
When you want to zoom in on one of the images, simply move the mouse pointer over that image. |
 |
| Year | Month | Day | Hour | Min | Sec | NOAA | Proj.U | Proj.WS | Corr.U | Corr.WS | B | L | LCM | Pos.angle | r | MU | MP |
|---|---|---|---|---|---|---|---|---|---|---|---|---|---|---|---|---|---|
| 2012 | 03 | 10 | 21 | 59 | 00 | 11429 | 267 | 1681 | 162 | 1017 | 17.94 | 300.47 | 23.42 | 318.01 | 0.5656 | 232.9 | -1.6 |
| Flare | Date | Start | Peak | End | Dur [s] | Peak [c/s] | Total Counts | Energy [keV] | X pos [asec] | Y pos [asec] | Radial [asec] | B [deg] | L [deg] | Flags |
|---|---|---|---|---|---|---|---|---|---|---|---|---|---|---|
| 12031069 | 10-Mar-2012 | 21:28:04 | 21:29:46 | 21:35:20 | 436 | 21 | 41389 | 6-12 | 447 | 398 | 598 | 18.16 | 305.55 | A0 DF P1 PE |
| 12031070 | 10-Mar-2012 | 21:35:20 | 21:36:22 | 21:40:44 | 324 | 24 | 29842 | 12-25 | 450 | 398 | 601 | 18.17 | 305.70 | A0 DF P1 PE |
| 12031071 | 10-Mar-2012 | 21:40:44 | 21:42:10 | 21:47:36 | 412 | 21 | 37228 | 6-12 | 449 | 395 | 598 | 17.97 | 305.54 | A0 DF P1 PE |
| 12031072 | 10-Mar-2012 | 21:49:40 | 21:49:46 | 21:49:52 | 12 | 18 | 963 | 6-12 | 453 | 397 | 602 | 18.12 | 305.79 | A0 DF P1 PE |
| 12031074 | 10-Mar-2012 | 21:57:56 | 21:58:10 | 21:59:00 | 64 | 16 | 4669 | 6-12 | 454 | 402 | 607 | 18.46 | 305.85 | A0 DF DR P1 PE |
| 12031075 | 10-Mar-2012 | 22:01:20 | 22:01:22 | 22:02:36 | 76 | 16 | 5440 | 6-12 | 451 | 386 | 594 | 17.38 | 305.40 | A0 DF DR P1 PE |
| Date | Start | Peak | End | Classification | B [deg] | LCM [deg] |
|---|---|---|---|---|---|---|
| No data |

