move the mouse pointer over that image.
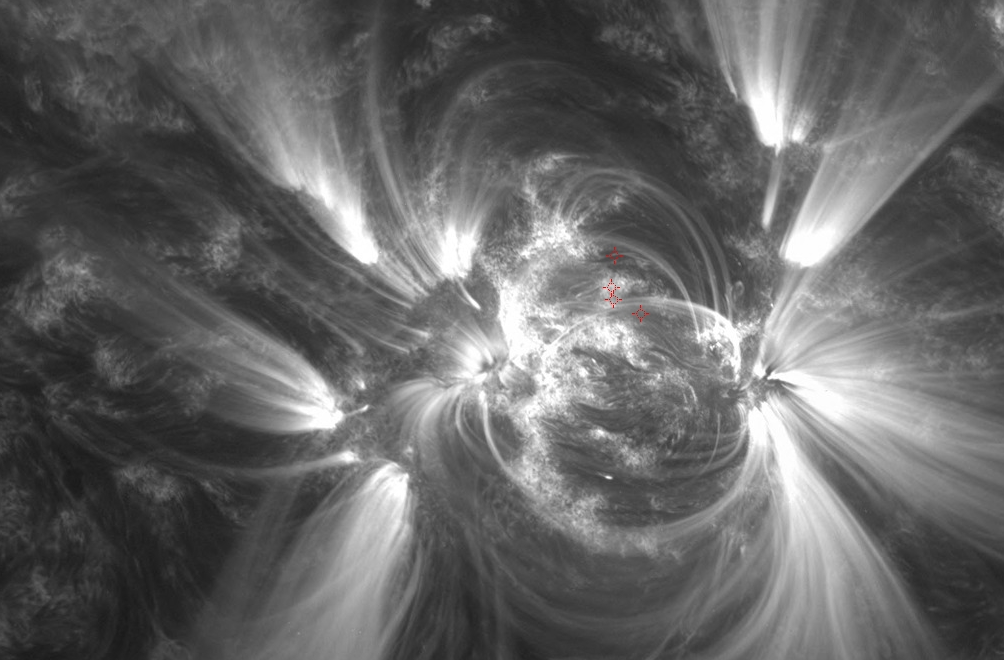
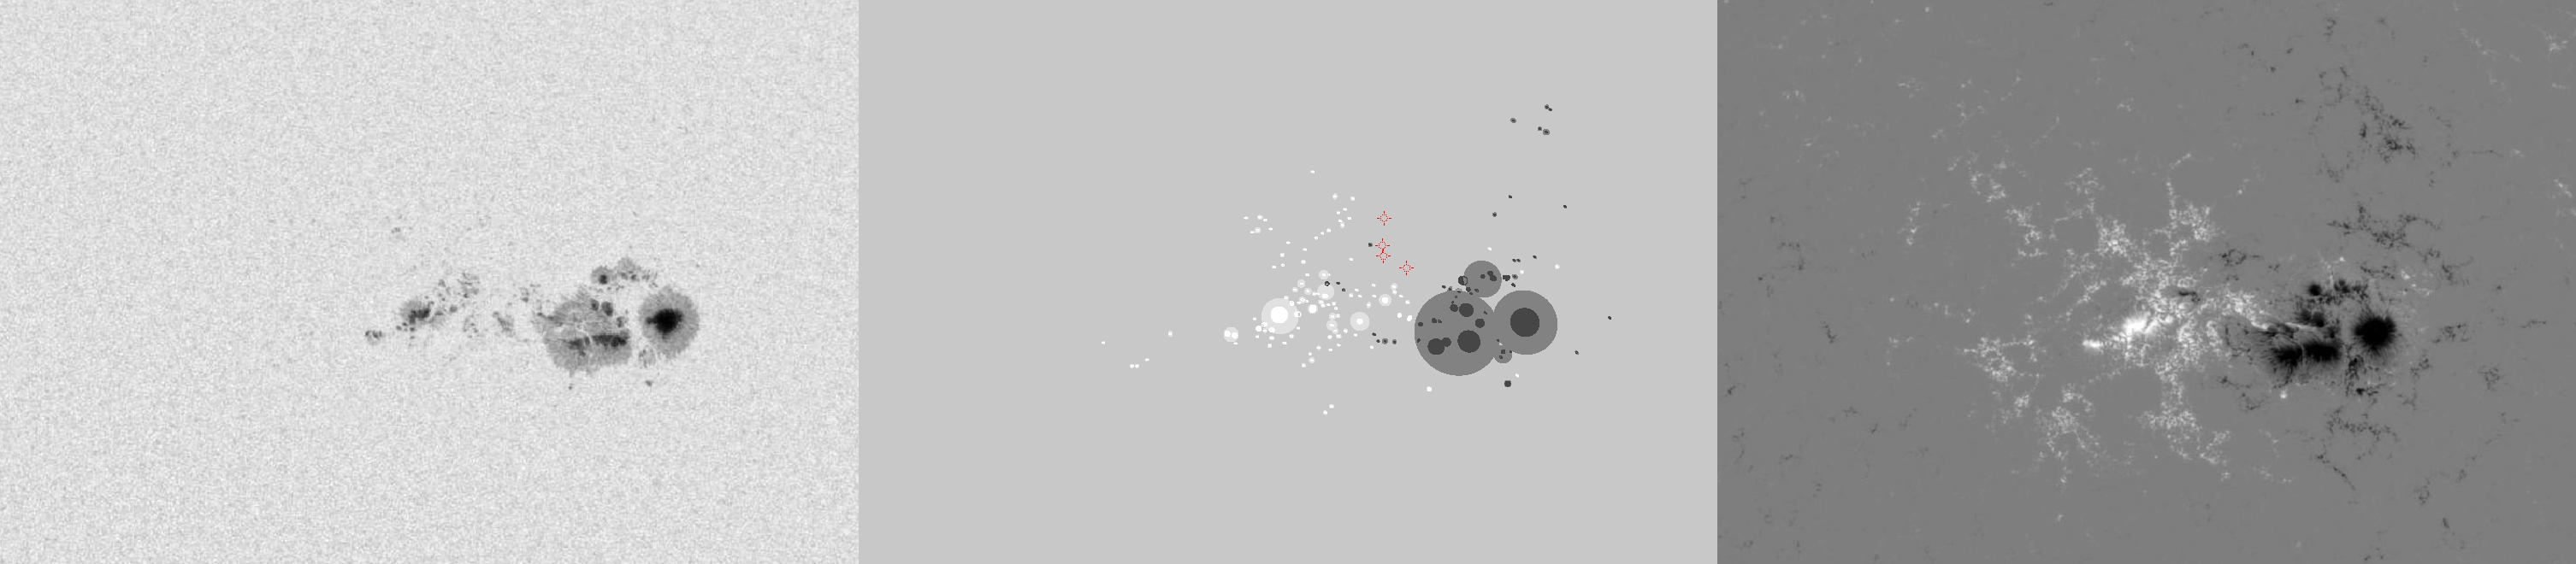
| Evolution of sunspot group NOAA 11339 and positions of flares in it animated by using the data of SDO/HMI Debrecen Data (HMIDD) sunspot catalogue (lower panel, middle, ellipses with positions and areas corresponding to the relevant data of spots in SDO and with grey-scale colour coding of the magnetic polarities corresponding to that of the magnetograms), SDO/HMI continuum images (lower panel, left) and magnetograms (lower panel, right), SDO/AIA images (upper panel, middle), GOES and RHESSI flare data (red and blue symbols) observed within the interval around the time of HMIDD data. |
|
When you want to zoom in on one of the images, simply move the mouse pointer over that image. |
 |
| Year | Month | Day | Hour | Min | Sec | NOAA | Proj.U | Proj.WS | Corr.U | Corr.WS | B | L | LCM | Pos.angle | r | MU | MP |
|---|---|---|---|---|---|---|---|---|---|---|---|---|---|---|---|---|---|
| 2011 | 11 | 09 | 01 | 58 | 59 | 11339 | 412 | 2463 | 220 | 1299 | 19.15 | 105.39 | 10.28 | 327.90 | 0.3180 | -697.0 | -241.2 |
| Flare | Date | Start | Peak | End | Dur [s] | Peak [c/s] | Total Counts | Energy [keV] | X pos [asec] | Y pos [asec] | Radial [asec] | B [deg] | L [deg] | Flags |
|---|---|---|---|---|---|---|---|---|---|---|---|---|---|---|
| 11110904 | 9-Nov-2011 | 01:31:56 | 01:37:26 | 01:38:28 | 392 | 68 | 88960 | 6-12 | 127 | 313 | 338 | 22.61 | 102.49 | A0 |
| 11110934 | 9-Nov-2011 | 01:38:28 | 01:40:14 | 01:42:00 | 212 | 200 | 84360 | 6-12 | 146 | 296 | 330 | 21.54 | 103.63 | A0 |
| 11110905 | 9-Nov-2011 | 01:42:00 | 01:43:54 | 01:51:32 | 572 | 128 | 224360 | 6-12 | 130 | 333 | 357 | 23.87 | 102.71 | A0 |
| 11110906 | 9-Nov-2011 | 01:51:32 | 02:09:46 | 02:14:56 | 1404 | 848 | 2783360 | 12-25 | 137 | 305 | 335 | 22.10 | 102.82 | A0 DR GE P1 PE |
| Date | Start | Peak | End | Classification | B [deg] | LCM [deg] |
|---|---|---|---|---|---|---|
| No data |

