move the mouse pointer over that image.
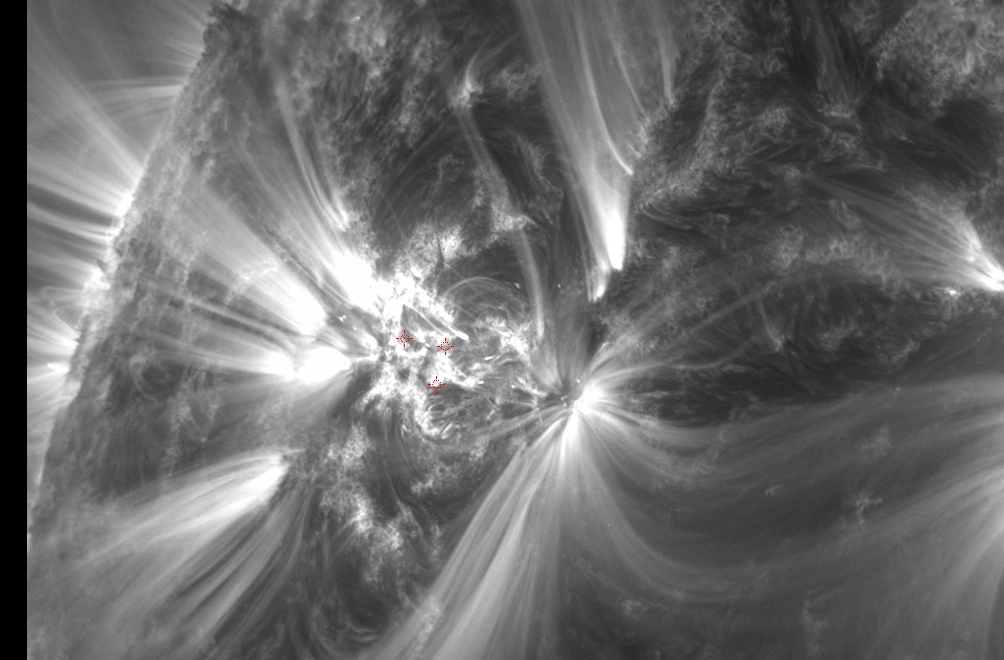
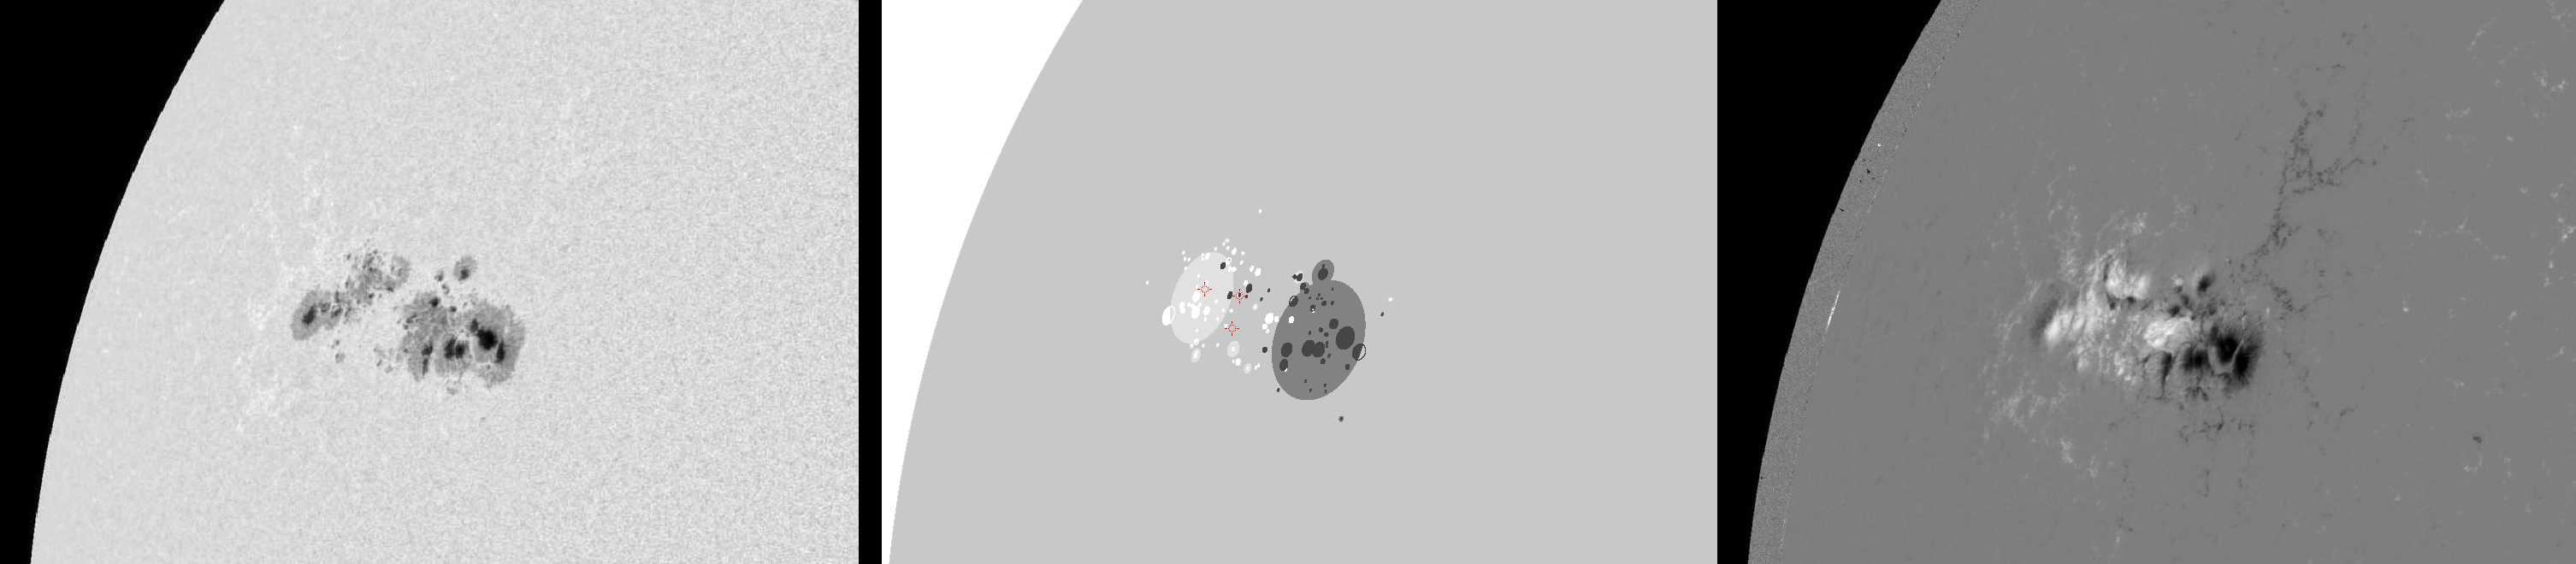
| Evolution of sunspot group NOAA 11339 and positions of flares in it animated by using the data of SDO/HMI Debrecen Data (HMIDD) sunspot catalogue (lower panel, middle, ellipses with positions and areas corresponding to the relevant data of spots in SDO and with grey-scale colour coding of the magnetic polarities corresponding to that of the magnetograms), SDO/HMI continuum images (lower panel, left) and magnetograms (lower panel, right), SDO/AIA images (upper panel, middle), GOES and RHESSI flare data (red and blue symbols) observed within the interval around the time of HMIDD data. |
|
When you want to zoom in on one of the images, simply move the mouse pointer over that image. |
 |
| Year | Month | Day | Hour | Min | Sec | NOAA | Proj.U | Proj.WS | Corr.U | Corr.WS | B | L | LCM | Pos.angle | r | MU | MP |
|---|---|---|---|---|---|---|---|---|---|---|---|---|---|---|---|---|---|
| 2011 | 11 | 04 | 17 | 58 | 59 | 11339 | 398 | 2598 | 301 | 1976 | 19.20 | 104.31 | -47.95 | 67.90 | 0.7566 | -273.6 | 44.8 |
| Flare | Date | Start | Peak | End | Dur [s] | Peak [c/s] | Total Counts | Energy [keV] | X pos [asec] | Y pos [asec] | Radial [asec] | B [deg] | L [deg] | Flags |
|---|---|---|---|---|---|---|---|---|---|---|---|---|---|---|
| 11110443 | 4-Nov-2011 | 17:33:24 | 17:34:06 | 17:47:24 | 840 | 185 | 332641 | 6-12 | -718 | 297 | 777 | 20.53 | 98.57 | A0 DF DR P1 |
| 11110444 | 4-Nov-2011 | 17:47:24 | 17:53:26 | 17:57:44 | 620 | 68 | 110969 | 6-12 | -689 | 292 | 749 | 20.38 | 101.43 | A0 DF DR P1 |
| 11110445 | 4-Nov-2011 | 17:57:44 | 18:05:14 | 18:09:24 | 700 | 224 | 316360 | 12-25 | -692 | 268 | 743 | 18.90 | 101.66 | A0 DF DR P1 |
| Date | Start | Peak | End | Classification | B [deg] | LCM [deg] |
|---|---|---|---|---|---|---|
| No data |

