move the mouse pointer over that image.
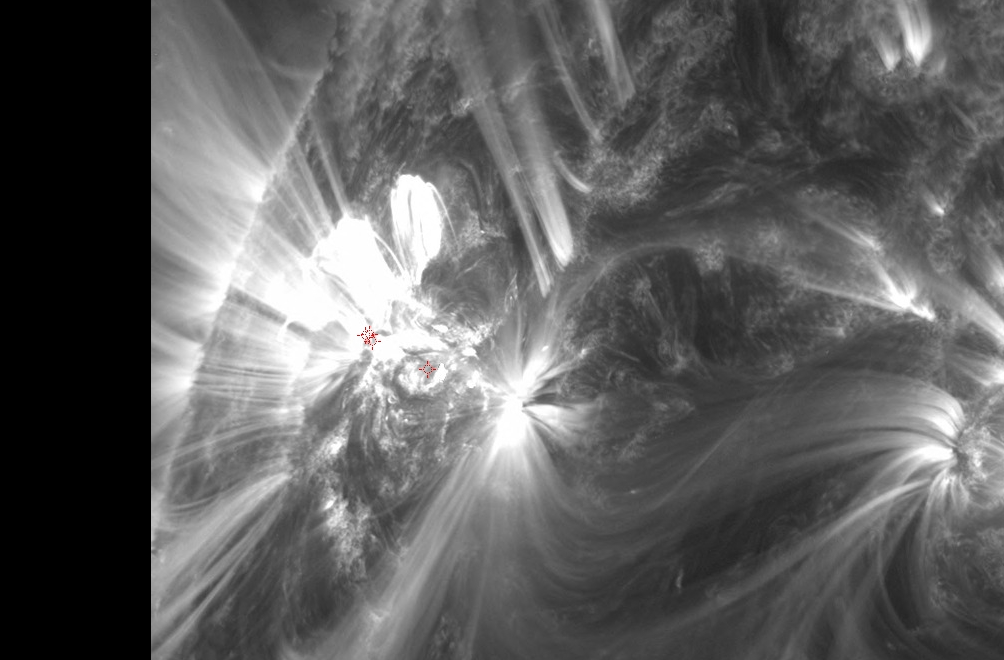
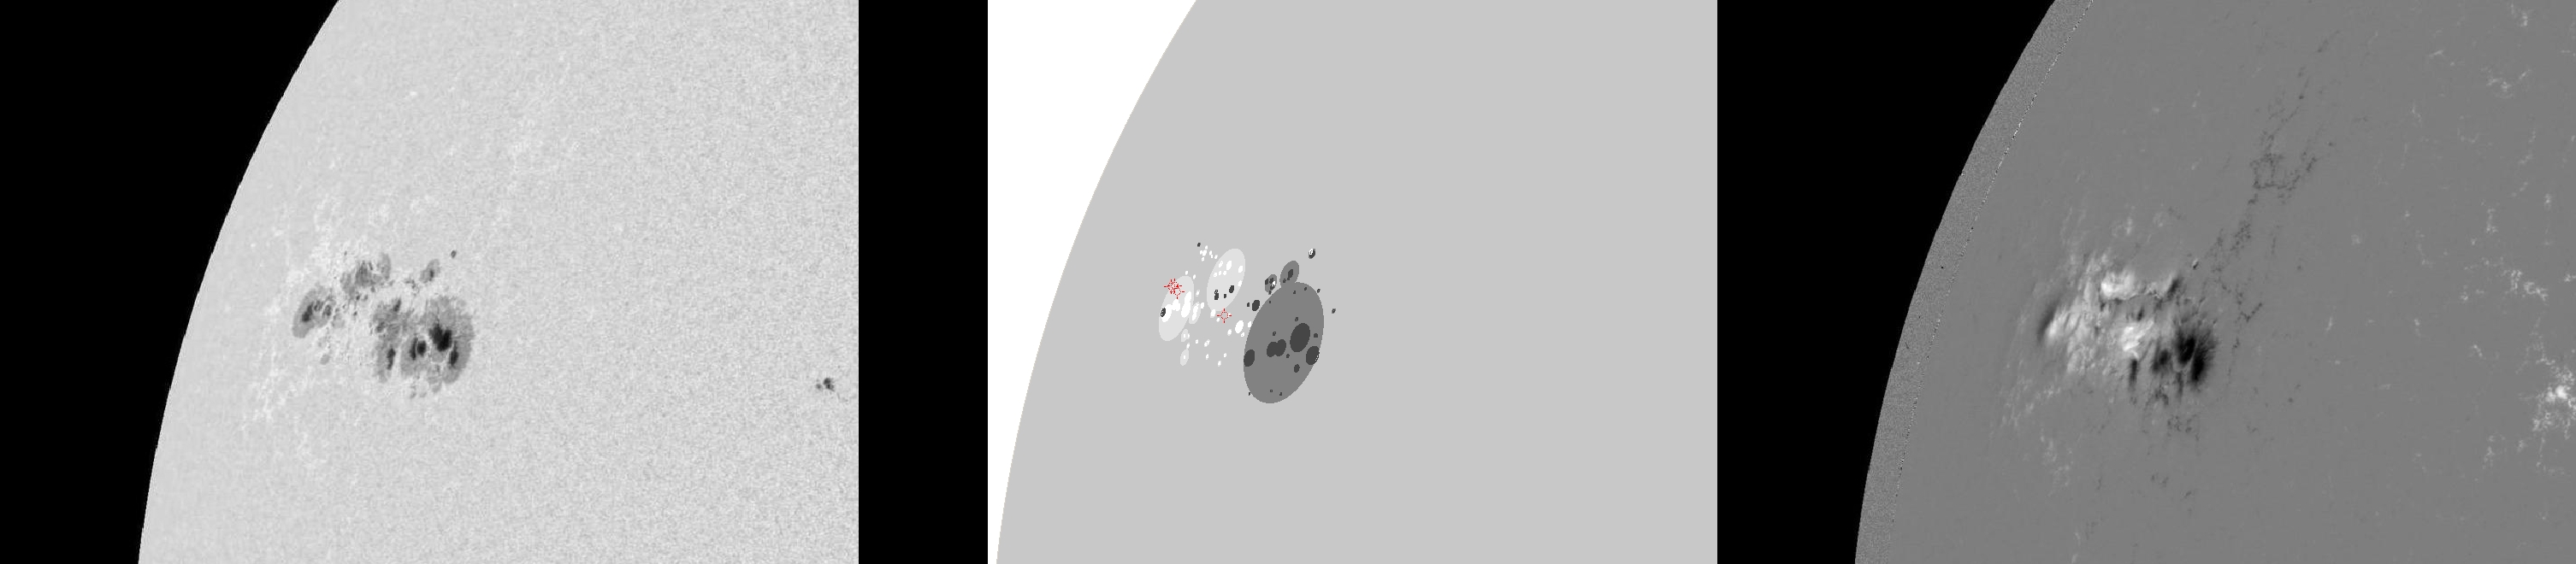
| Evolution of sunspot group NOAA 11339 and positions of flares in it animated by using the data of SDO/HMI Debrecen Data (HMIDD) sunspot catalogue (lower panel, middle, ellipses with positions and areas corresponding to the relevant data of spots in SDO and with grey-scale colour coding of the magnetic polarities corresponding to that of the magnetograms), SDO/HMI continuum images (lower panel, left) and magnetograms (lower panel, right), SDO/AIA images (upper panel, middle), GOES and RHESSI flare data (red and blue symbols) observed within the interval around the time of HMIDD data. |
|
When you want to zoom in on one of the images, simply move the mouse pointer over that image. |
 |
| Year | Month | Day | Hour | Min | Sec | NOAA | Proj.U | Proj.WS | Corr.U | Corr.WS | B | L | LCM | Pos.angle | r | MU | MP |
|---|---|---|---|---|---|---|---|---|---|---|---|---|---|---|---|---|---|
| 2011 | 11 | 03 | 22 | 58 | 59 | 11339 | 324 | 2098 | 310 | 2009 | 19.24 | 104.77 | -57.91 | 69.85 | 0.8514 | -265.1 | 59.5 |
| Flare | Date | Start | Peak | End | Dur [s] | Peak [c/s] | Total Counts | Energy [keV] | X pos [asec] | Y pos [asec] | Radial [asec] | B [deg] | L [deg] | Flags |
|---|---|---|---|---|---|---|---|---|---|---|---|---|---|---|
| 11110360 | 3-Nov-2011 | 22:32:48 | 22:34:02 | 22:42:32 | 584 | 144 | 176803 | 12-25 | -817 | 304 | 872 | 20.28 | 96.86 | a0 A1 |
| 11110354 | 3-Nov-2011 | 22:45:16 | 22:47:18 | 22:49:32 | 256 | 13 | 13914 | 6-12 | -817 | 308 | 873 | 20.52 | 96.55 | A0 DF P1 |
| 11110355 | 3-Nov-2011 | 22:55:44 | 22:59:46 | 23:04:36 | 532 | 208 | 245940 | 12-25 | -778 | 286 | 829 | 19.52 | 102.48 | a0 A1 DF DR P1 |
| 11110385 | 3-Nov-2011 | 23:04:36 | 23:10:06 | 23:16:48 | 732 | 368 | 577396 | 12-25 | -817 | 307 | 873 | 20.46 | 96.39 | a0 A1 DF P1 Q2 |
| Date | Start | Peak | End | Classification | B [deg] | LCM [deg] |
|---|---|---|---|---|---|---|
| No data |

