move the mouse pointer over that image.
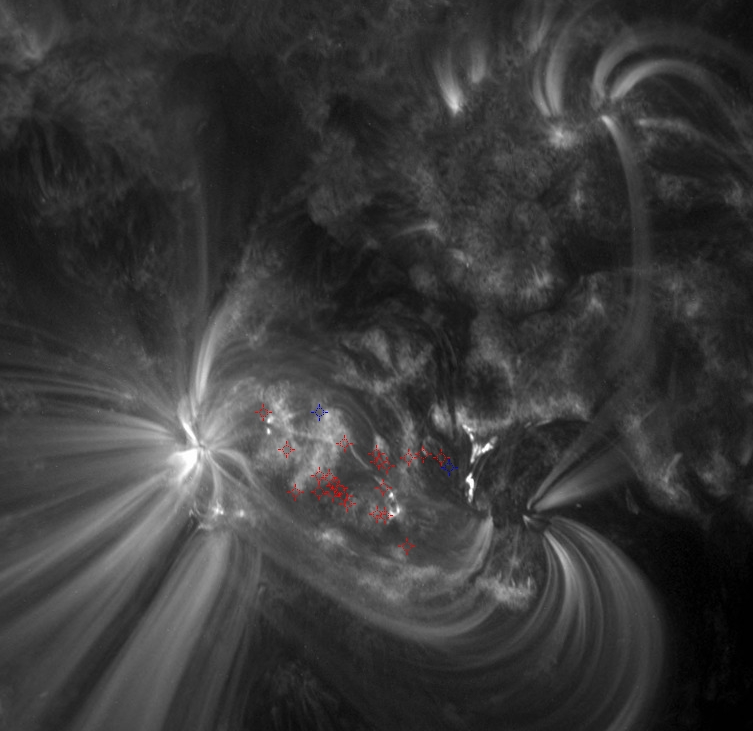
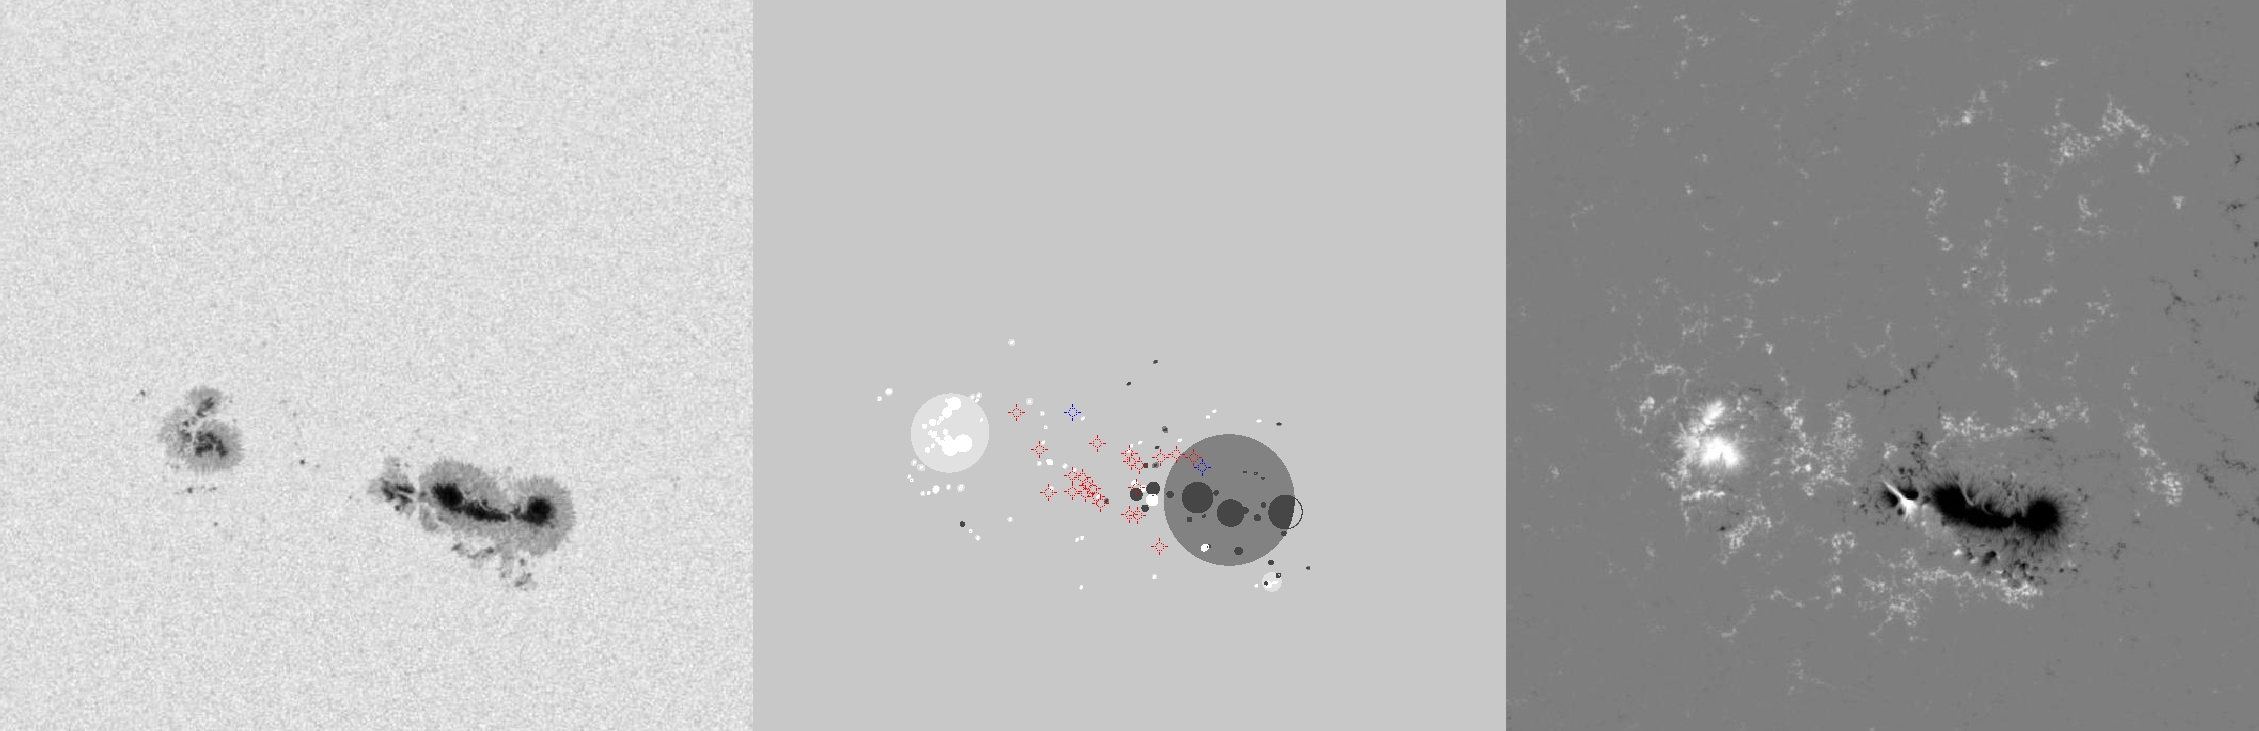
| Evolution of sunspot group NOAA 11302 and positions of flares in it animated by using the data of SDO/HMI Debrecen Data (HMIDD) sunspot catalogue (lower panel, middle, ellipses with positions and areas corresponding to the relevant data of spots in SDO and with grey-scale colour coding of the magnetic polarities corresponding to that of the magnetograms), SDO/HMI continuum images (lower panel, left) and magnetograms (lower panel, right), SDO/AIA images (upper panel, middle), GOES and RHESSI flare data (red and blue symbols) observed within the interval around the time of HMIDD data. |
|
When you want to zoom in on one of the images, simply move the mouse pointer over that image. |
 |
| Year | Month | Day | Hour | Min | Sec | NOAA | Proj.U | Proj.WS | Corr.U | Corr.WS | B | L | LCM | Pos.angle | r | MU | MP |
|---|---|---|---|---|---|---|---|---|---|---|---|---|---|---|---|---|---|
| 2011 | 09 | 28 | 06 | 02 | 05 | 11302 | 520 | 2597 | 263 | 1310 | 13.18 | 281.51 | -5.37 | 39.68 | 0.1438 | -653.7 | -101.2 |
| Flare | Date | Start | Peak | End | Dur [s] | Peak [c/s] | Total Counts | Energy [keV] | X pos [asec] | Y pos [asec] | Radial [asec] | B [deg] | L [deg] | Flags |
|---|---|---|---|---|---|---|---|---|---|---|---|---|---|---|
| 11092811 | 28-Sep-2011 | 05:50:20 | 05:51:34 | 05:58:00 | 460 | 38 | 59500 | 6-12 | -80 | 89 | 120 | 12.17 | 281.08 | A0 |
| 11092812 | 28-Sep-2011 | 06:01:20 | 06:02:10 | 06:05:12 | 232 | 72 | 34900 | 6-12 | -42 | 125 | 132 | 14.35 | 283.28 | A0 |
| 11092814 | 28-Sep-2011 | 06:29:28 | 06:30:22 | 06:31:00 | 92 | 48 | 17800 | 6-12 | -94 | 134 | 164 | 14.86 | 279.80 | A0 DR P1 |
| 11092815 | 28-Sep-2011 | 06:34:08 | 06:35:02 | 06:35:52 | 104 | 52 | 17680 | 6-12 | -72 | 89 | 115 | 12.18 | 281.17 | A0 |
| 11092842 | 28-Sep-2011 | 07:19:04 | 07:19:34 | 07:20:04 | 60 | 26 | 6140 | 6-12 | -40 | 69 | 80 | 11.00 | 282.72 | A0 DR P1 |
| 11092817 | 28-Sep-2011 | 07:22:32 | 07:25:06 | 07:30:48 | 496 | 52 | 61440 | 6-12 | -53 | 106 | 118 | 13.20 | 281.86 | A0 DR P1 |
| 11092843 | 28-Sep-2011 | 07:32:56 | 07:33:26 | 07:33:56 | 60 | 26 | 5540 | 6-12 | -26 | 127 | 129 | 14.47 | 283.42 | A0 |
| 11092818 | 28-Sep-2011 | 07:47:20 | 07:48:06 | 07:48:56 | 96 | 34 | 11520 | 6-12 | -77 | 107 | 132 | 13.25 | 280.17 | A0 DR P1 |
| 11092819 | 28-Sep-2011 | 07:49:48 | 07:50:30 | 07:52:44 | 176 | 128 | 37600 | 6-12 | -73 | 105 | 128 | 13.13 | 280.40 | A0 DR P1 PE |
| 11092820 | 28-Sep-2011 | 07:52:44 | 07:54:50 | 08:04:40 | 716 | 152 | 122440 | 6-12 | -69 | 100 | 122 | 12.84 | 280.61 | A0 DR P1 PE |
| 11092821 | 28-Sep-2011 | 08:10:32 | 08:13:26 | 08:16:40 | 368 | 168 | 105800 | 6-12 | -61 | 96 | 114 | 12.60 | 280.93 | A0 |
| 11092822 | 28-Sep-2011 | 08:52:44 | 08:53:26 | 08:54:28 | 104 | 36 | 12940 | 6-12 | -59 | 102 | 118 | 12.96 | 280.68 | A0 DR P1 |
| 11092823 | 28-Sep-2011 | 08:59:48 | 09:00:34 | 09:02:36 | 168 | 80 | 22700 | 6-12 | -65 | 103 | 122 | 13.01 | 280.25 | A0 |
| 11092844 | 28-Sep-2011 | 09:02:36 | 09:03:34 | 09:04:44 | 128 | 20 | 10180 | 6-12 | -58 | 112 | 126 | 13.56 | 280.64 | A0 |
| 11092824 | 28-Sep-2011 | 09:06:16 | 09:07:10 | 09:08:36 | 140 | 24 | 13520 | 6-12 | -63 | 113 | 130 | 13.61 | 280.30 | A0 |
| 11092845 | 28-Sep-2011 | 09:09:52 | 09:10:10 | 09:11:04 | 72 | 22 | 7320 | 6-12 | -77 | 102 | 128 | 12.95 | 279.43 | A0 |
| 11092825 | 28-Sep-2011 | 09:28:56 | 09:28:58 | 09:31:36 | 160 | 44 | 24560 | 6-12 | -20 | 122 | 124 | 14.17 | 282.73 | A0 DR P1 PE |
| 11092826 | 28-Sep-2011 | 09:53:16 | 09:53:58 | 09:54:28 | 72 | 72 | 8860 | 6-12 | -14 | 127 | 128 | 14.47 | 282.87 | A0 EE P1 |
| 11092827 | 28-Sep-2011 | 10:28:24 | 10:29:02 | 10:31:56 | 212 | 38 | 28280 | 6-12 | -75 | 152 | 170 | 15.95 | 278.76 | A0 DR P1 PE |
| 11092828 | 28-Sep-2011 | 10:41:08 | 10:42:18 | 10:43:52 | 164 | 34 | 22640 | 6-12 | -56 | 129 | 141 | 14.57 | 279.84 | A0 P1 Q1 |
| 11092829 | 28-Sep-2011 | 11:11:56 | 11:15:06 | 11:19:32 | 456 | 104 | 133240 | 6-12 | 30 | 125 | 128 | 14.34 | 284.83 | A0 DR P1 PE |
| 11092830 | 28-Sep-2011 | 11:22:00 | 11:23:14 | 11:27:52 | 352 | 112 | 92520 | 6-12 | 19 | 120 | 122 | 14.04 | 284.08 | A0 |
| Date | Start | Peak | End | Classification | B [deg] | LCM [deg] |
|---|---|---|---|---|---|---|
| 28-Sep-2011 | 08:20 | 08:24 | 08:27 | C1.4 | 14 | -02 |
| 28-Sep-2011 | 10:16 | 10:22 | 10:30 | B9.7 | 16 | -06 |

