move the mouse pointer over that image.
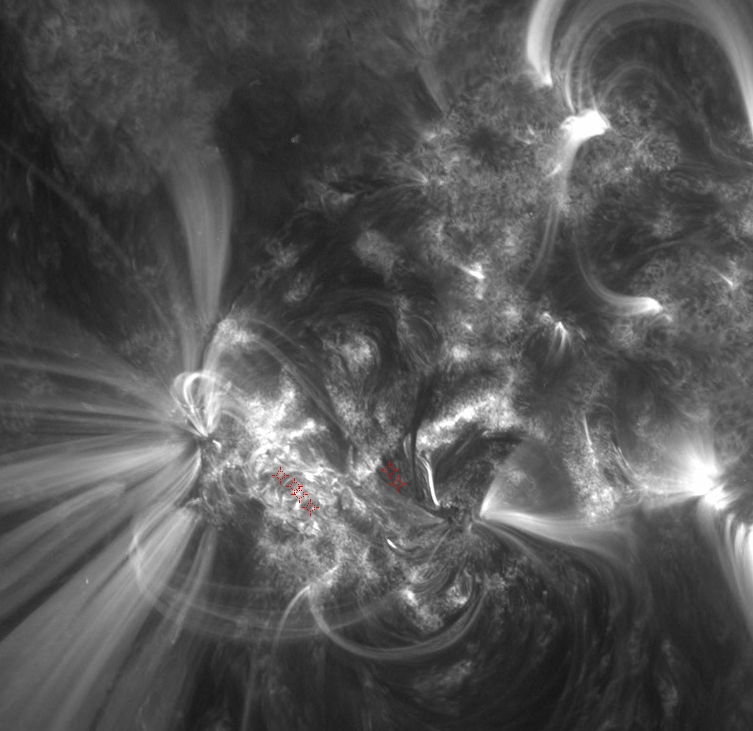
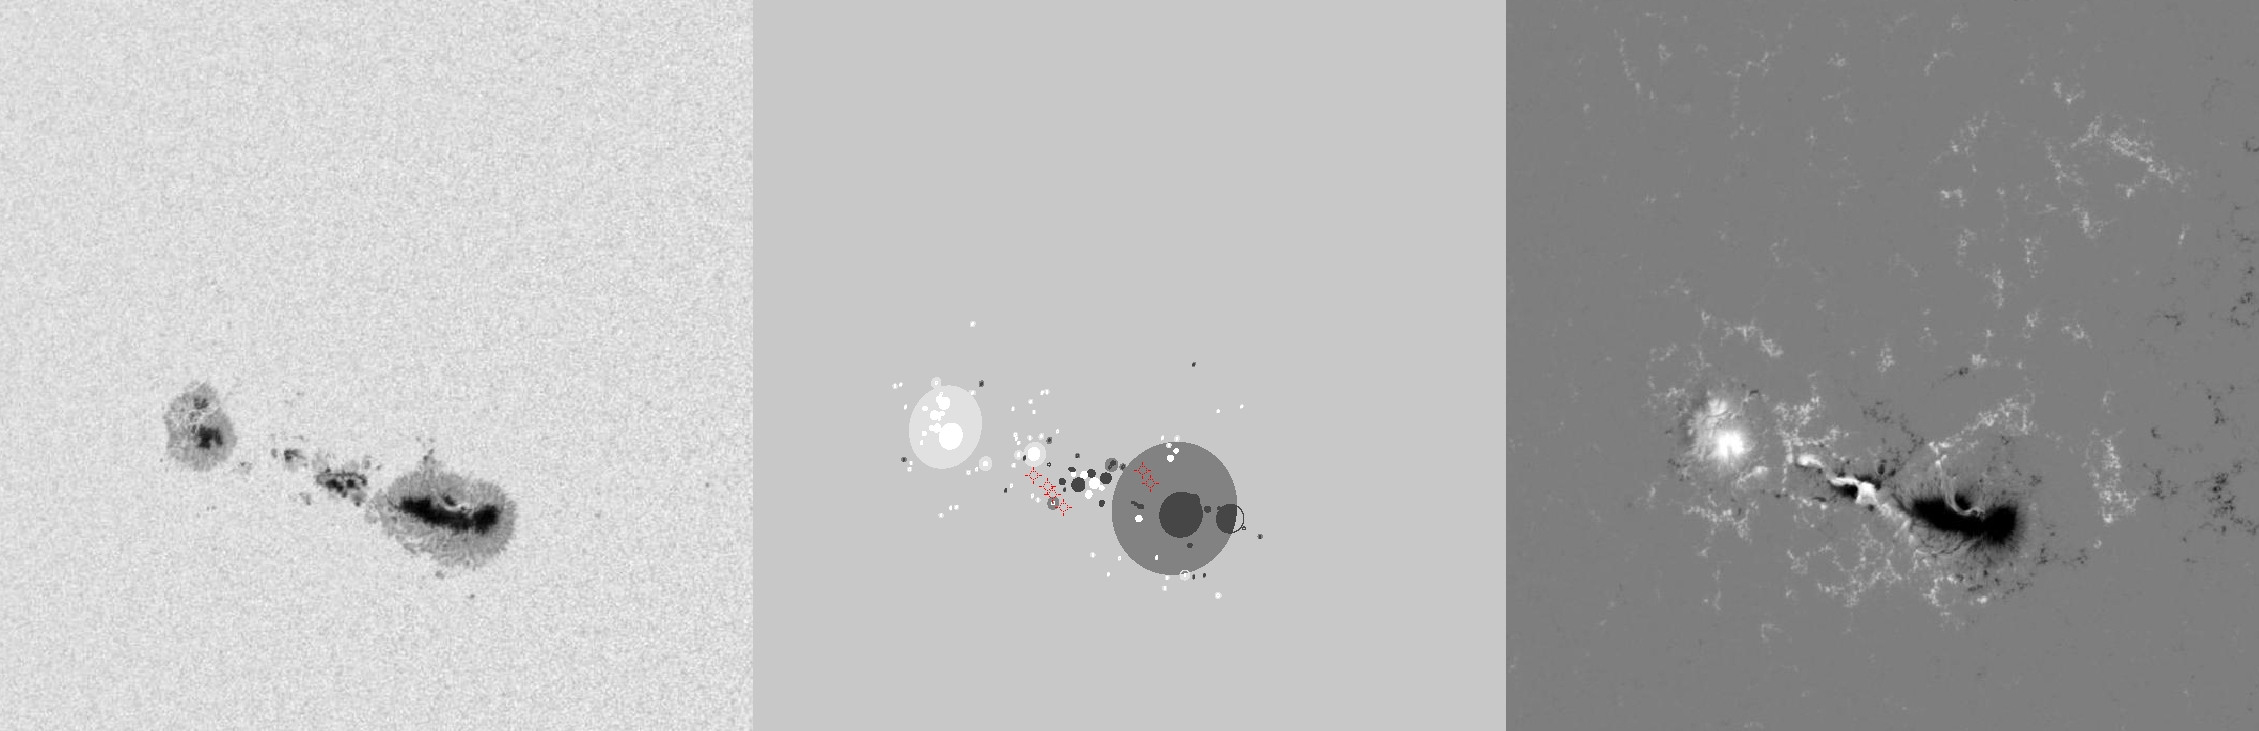
| Evolution of sunspot group NOAA 11302 and positions of flares in it animated by using the data of SDO/HMI Debrecen Data (HMIDD) sunspot catalogue (lower panel, middle, ellipses with positions and areas corresponding to the relevant data of spots in SDO and with grey-scale colour coding of the magnetic polarities corresponding to that of the magnetograms), SDO/HMI continuum images (lower panel, left) and magnetograms (lower panel, right), SDO/AIA images (upper panel, middle), GOES and RHESSI flare data (red and blue symbols) observed within the interval around the time of HMIDD data. |
|
When you want to zoom in on one of the images, simply move the mouse pointer over that image. |
 |
| Year | Month | Day | Hour | Min | Sec | NOAA | Proj.U | Proj.WS | Corr.U | Corr.WS | B | L | LCM | Pos.angle | r | MU | MP |
|---|---|---|---|---|---|---|---|---|---|---|---|---|---|---|---|---|---|
| 2011 | 09 | 26 | 18 | 59 | 05 | 11302 | 524 | 2590 | 282 | 1431 | 13.28 | 281.15 | -25.01 | 73.48 | 0.4292 | -562.1 | -21.1 |
| Flare | Date | Start | Peak | End | Dur [s] | Peak [c/s] | Total Counts | Energy [keV] | X pos [asec] | Y pos [asec] | Radial [asec] | B [deg] | L [deg] | Flags |
|---|---|---|---|---|---|---|---|---|---|---|---|---|---|---|
| 11092649 | 26-Sep-2011 | 18:35:20 | 18:37:30 | 18:41:48 | 388 | 36 | 52040 | 6-12 | -409 | 102 | 422 | 12.36 | 279.56 | A0 DF P1 |
| 11092682 | 26-Sep-2011 | 18:41:48 | 18:44:10 | 18:48:28 | 400 | 112 | 86240 | 6-12 | -426 | 122 | 443 | 13.49 | 278.20 | A0 DF P1 |
| 11092651 | 26-Sep-2011 | 18:51:40 | 18:52:38 | 18:54:40 | 180 | 46 | 27600 | 6-12 | -415 | 115 | 431 | 13.11 | 278.93 | A0 DF P1 |
| 11092683 | 26-Sep-2011 | 18:54:40 | 18:56:10 | 18:58:16 | 216 | 36 | 28400 | 6-12 | -411 | 110 | 426 | 12.83 | 279.20 | A0 DF P1 |
| 11092684 | 26-Sep-2011 | 19:05:24 | 19:06:18 | 19:07:08 | 104 | 34 | 13440 | 6-12 | -347 | 117 | 366 | 13.45 | 283.32 | A0 DF P1 PE |
| 11092652 | 26-Sep-2011 | 19:11:56 | 19:12:46 | 19:14:24 | 148 | 56 | 26160 | 6-12 | -350 | 125 | 372 | 13.92 | 283.02 | A0 DF P1 PE |
| Date | Start | Peak | End | Classification | B [deg] | LCM [deg] |
|---|---|---|---|---|---|---|
| No data |

