move the mouse pointer over that image.
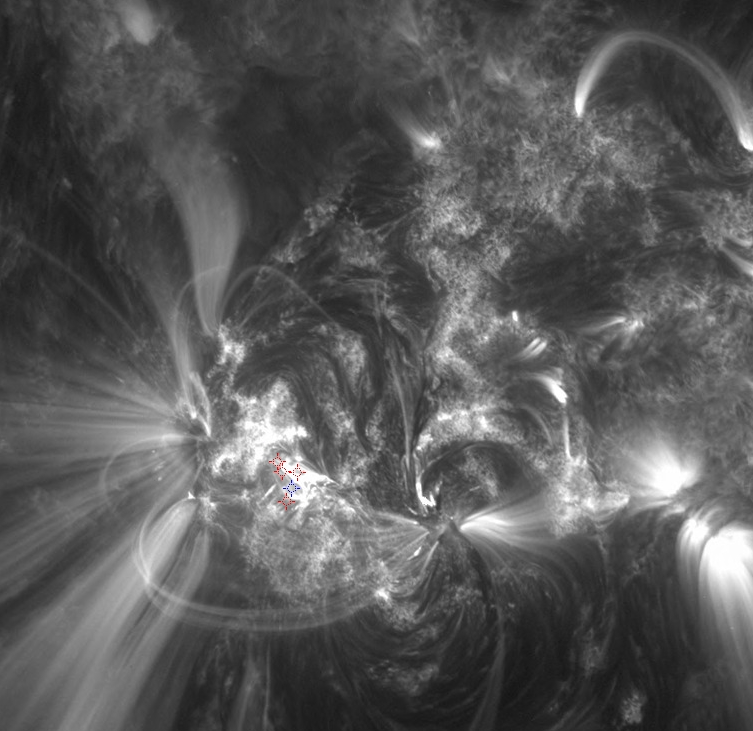
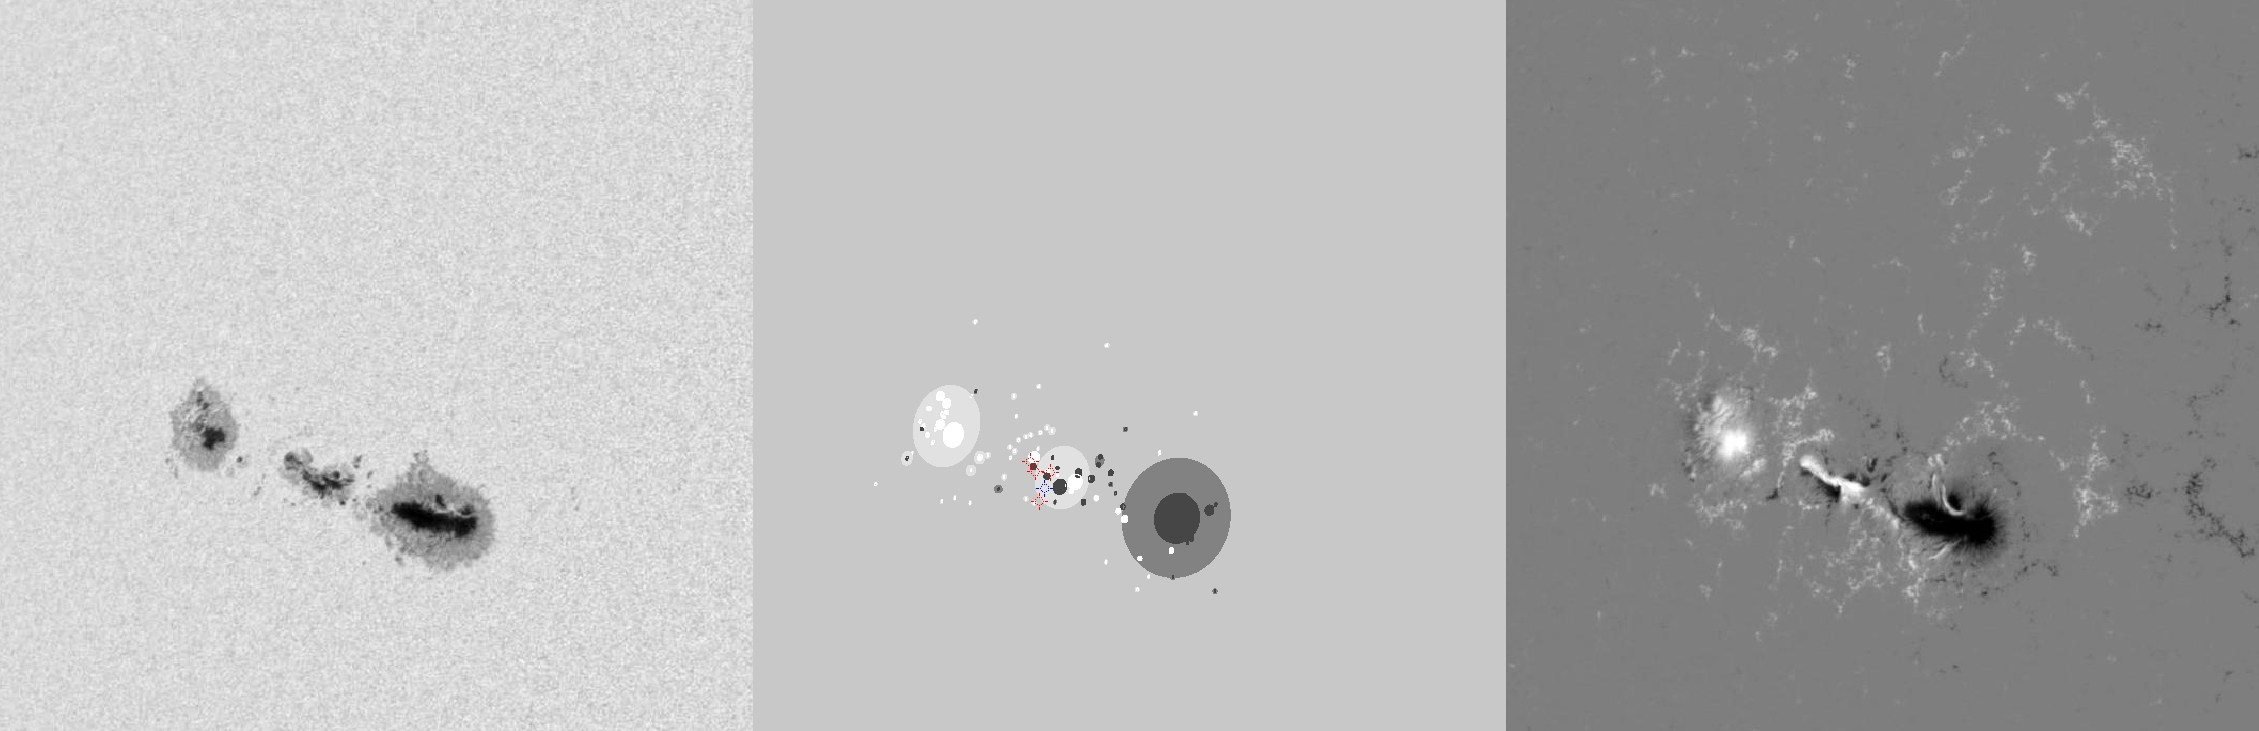
| Evolution of sunspot group NOAA 11302 and positions of flares in it animated by using the data of SDO/HMI Debrecen Data (HMIDD) sunspot catalogue (lower panel, middle, ellipses with positions and areas corresponding to the relevant data of spots in SDO and with grey-scale colour coding of the magnetic polarities corresponding to that of the magnetograms), SDO/HMI continuum images (lower panel, left) and magnetograms (lower panel, right), SDO/AIA images (upper panel, middle), GOES and RHESSI flare data (red and blue symbols) observed within the interval around the time of HMIDD data. |
|
When you want to zoom in on one of the images, simply move the mouse pointer over that image. |
 |
| Year | Month | Day | Hour | Min | Sec | NOAA | Proj.U | Proj.WS | Corr.U | Corr.WS | B | L | LCM | Pos.angle | r | MU | MP |
|---|---|---|---|---|---|---|---|---|---|---|---|---|---|---|---|---|---|
| 2011 | 09 | 26 | 07 | 59 | 05 | 11302 | 479 | 2417 | 279 | 1410 | 13.18 | 281.10 | -31.11 | 75.99 | 0.5186 | -469.6 | -4.1 |
| Flare | Date | Start | Peak | End | Dur [s] | Peak [c/s] | Total Counts | Energy [keV] | X pos [asec] | Y pos [asec] | Radial [asec] | B [deg] | L [deg] | Flags |
|---|---|---|---|---|---|---|---|---|---|---|---|---|---|---|
| 11092618 | 26-Sep-2011 | 07:24:56 | 07:31:34 | 07:44:16 | 1160 | 56 | 91491 | 12-25 | -499 | 129 | 515 | 13.62 | 279.20 | a0 A1 DF DR ES P1 |
| 11092672 | 26-Sep-2011 | 07:44:16 | 07:49:34 | 07:57:28 | 792 | 416 | 238168 | 12-25 | -504 | 129 | 520 | 13.60 | 278.68 | a0 A1 DF DR P1 |
| 11092621 | 26-Sep-2011 | 07:57:28 | 07:58:34 | 08:04:32 | 424 | 4 | 5749 | 6-12 | -505 | 135 | 523 | 13.95 | 278.47 | A0 DF DR P1 |
| 11092619 | 26-Sep-2011 | 08:04:32 | 08:14:18 | 08:20:28 | 956 | 3 | 10273 | 6-12 | -495 | 110 | 508 | 12.51 | 279.26 | A0 DF DR P1 |
| Date | Start | Peak | End | Classification | B [deg] | LCM [deg] |
|---|---|---|---|---|---|---|
| 26-Sep-2011 | 07:45 | 07:50 | 07:52 | C8.8 | 13 | -33 |

