move the mouse pointer over that image.
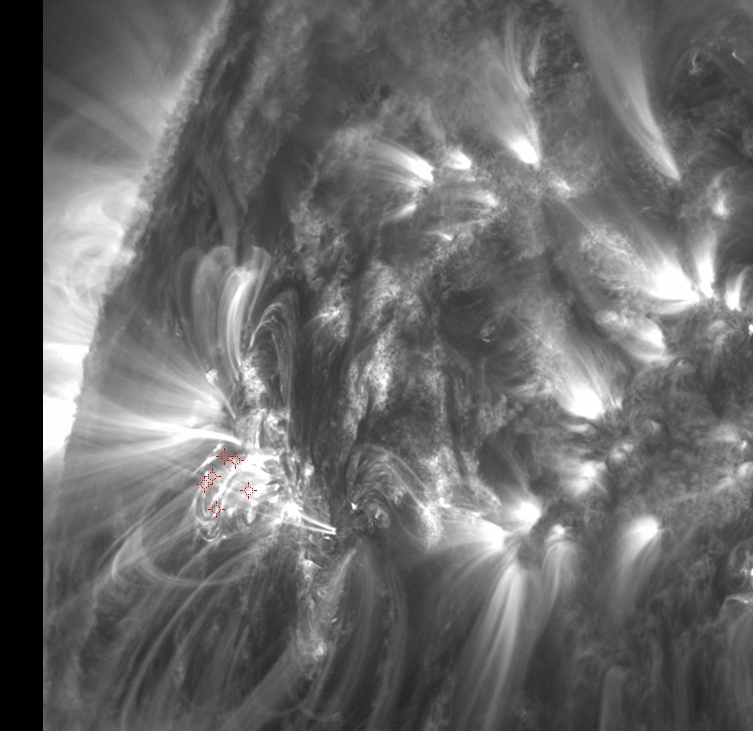
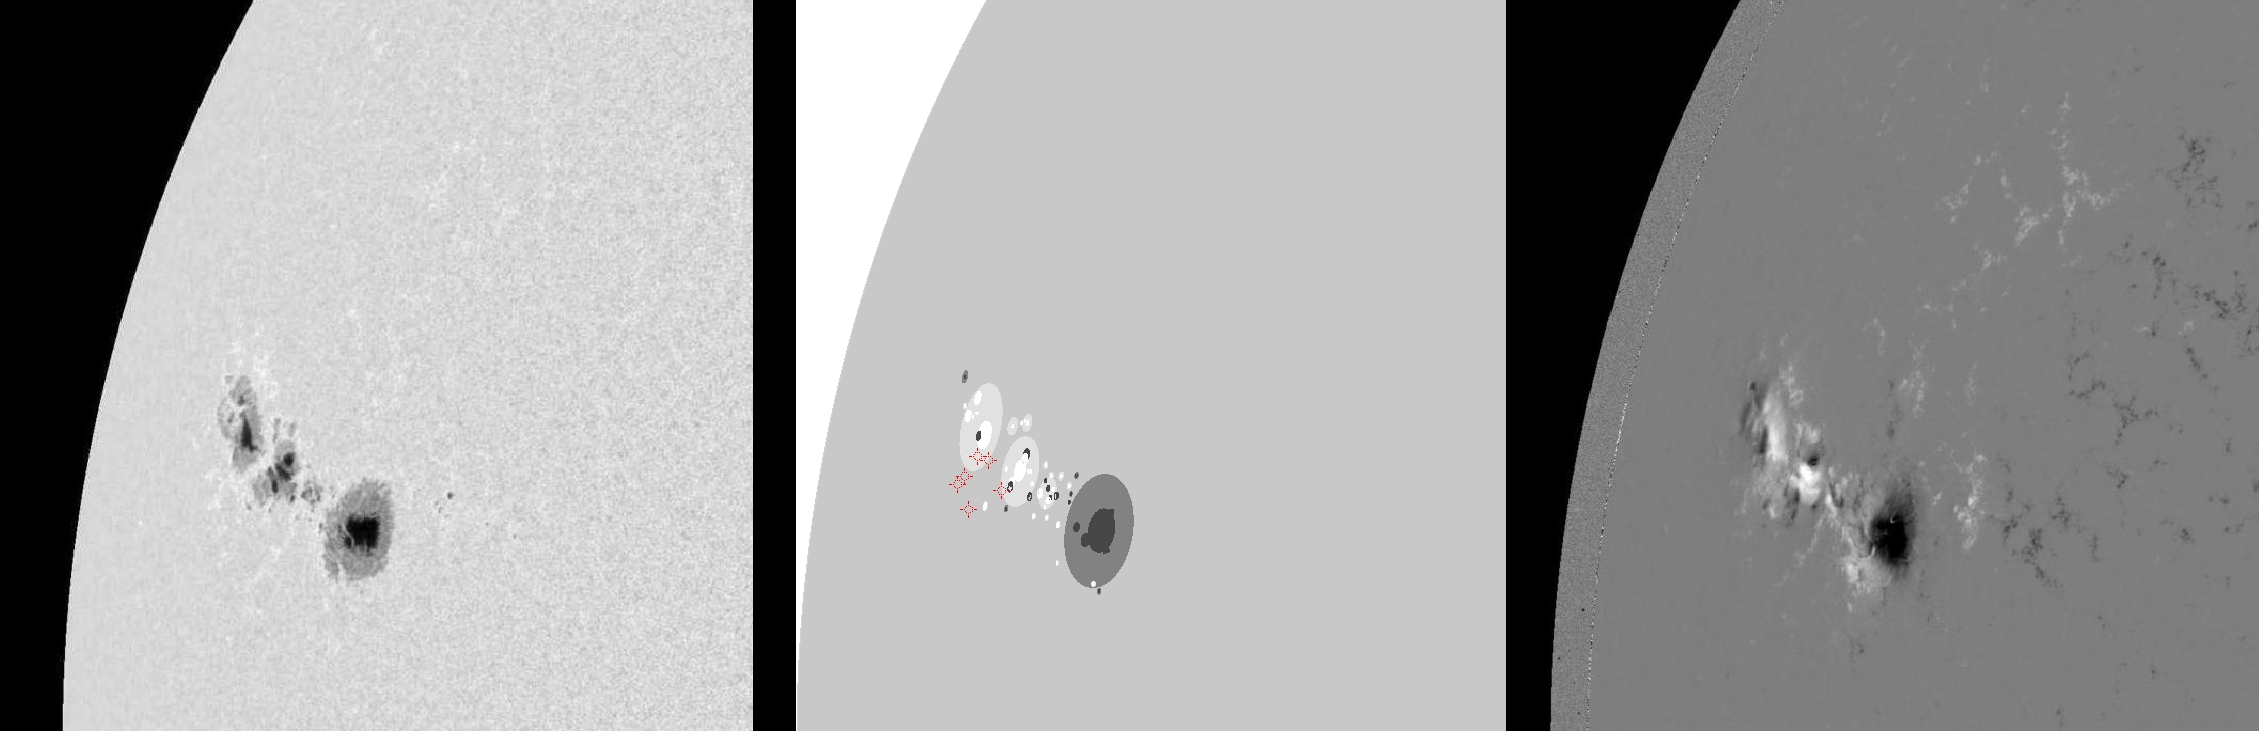
| Evolution of sunspot group NOAA 11302 and positions of flares in it animated by using the data of SDO/HMI Debrecen Data (HMIDD) sunspot catalogue (lower panel, middle, ellipses with positions and areas corresponding to the relevant data of spots in SDO and with grey-scale colour coding of the magnetic polarities corresponding to that of the magnetograms), SDO/HMI continuum images (lower panel, left) and magnetograms (lower panel, right), SDO/AIA images (upper panel, middle), GOES and RHESSI flare data (red and blue symbols) observed within the interval around the time of HMIDD data. |
|
When you want to zoom in on one of the images, simply move the mouse pointer over that image. |
 |
| Year | Month | Day | Hour | Min | Sec | NOAA | Proj.U | Proj.WS | Corr.U | Corr.WS | B | L | LCM | Pos.angle | r | MU | MP |
|---|---|---|---|---|---|---|---|---|---|---|---|---|---|---|---|---|---|
| 2011 | 09 | 24 | 04 | 59 | 05 | 11302 | 269 | 1558 | 256 | 1499 | 13.06 | 280.85 | -59.39 | 78.98 | 0.8536 | -252.6 | 29.1 |
| Flare | Date | Start | Peak | End | Dur [s] | Peak [c/s] | Total Counts | Energy [keV] | X pos [asec] | Y pos [asec] | Radial [asec] | B [deg] | L [deg] | Flags |
|---|---|---|---|---|---|---|---|---|---|---|---|---|---|---|
| 11092417 | 24-Sep-2011 | 04:28:12 | 04:31:06 | 04:40:04 | 712 | 288 | 366920 | 12-25 | -831 | 172 | 849 | 13.60 | 276.66 | A0 DF P1 |
| 11092418 | 24-Sep-2011 | 04:40:04 | 04:44:34 | 04:51:36 | 692 | 368 | 415640 | 12-25 | -836 | 174 | 854 | 13.64 | 275.83 | A0 DF P1 |
| 11092419 | 24-Sep-2011 | 04:51:36 | 04:52:58 | 04:54:00 | 144 | 46 | 25680 | 6-12 | -843 | 161 | 858 | 12.79 | 275.18 | A0 DF P1 |
| 11092420 | 24-Sep-2011 | 04:54:00 | 04:57:46 | 05:00:16 | 376 | 320 | 135200 | 6-12 | -819 | 152 | 834 | 12.60 | 278.42 | A0 DF DR P1 |
| 11092473 | 24-Sep-2011 | 05:00:16 | 05:02:50 | 05:03:00 | 164 | 36 | 25120 | 6-12 | -839 | 140 | 851 | 11.63 | 276.15 | A0 DF DR P1 |
| 11092422 | 24-Sep-2011 | 05:03:00 | 05:20:46 | 05:22:24 | 1164 | 416 | 892960 | 6-12 | -844 | 155 | 858 | 12.43 | 274.95 | A0 DF DR EE P1 |
| Date | Start | Peak | End | Classification | B [deg] | LCM [deg] |
|---|---|---|---|---|---|---|
| No data |

