move the mouse pointer over that image.
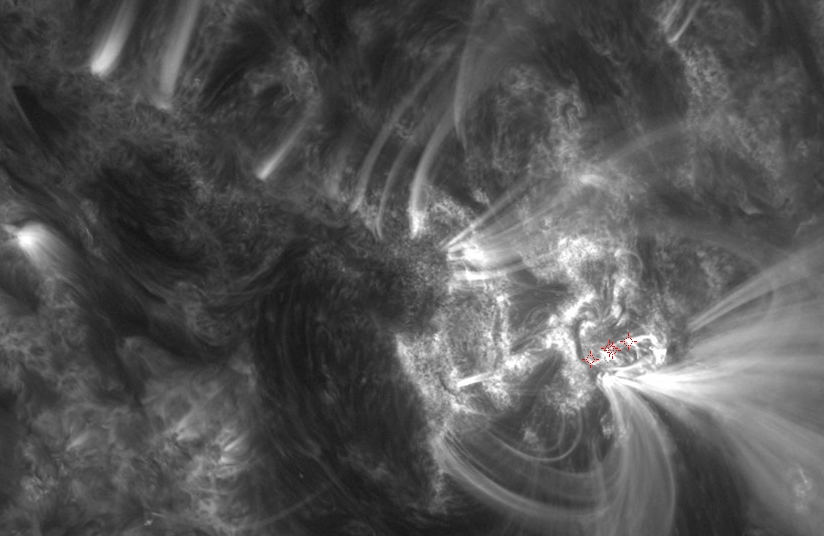
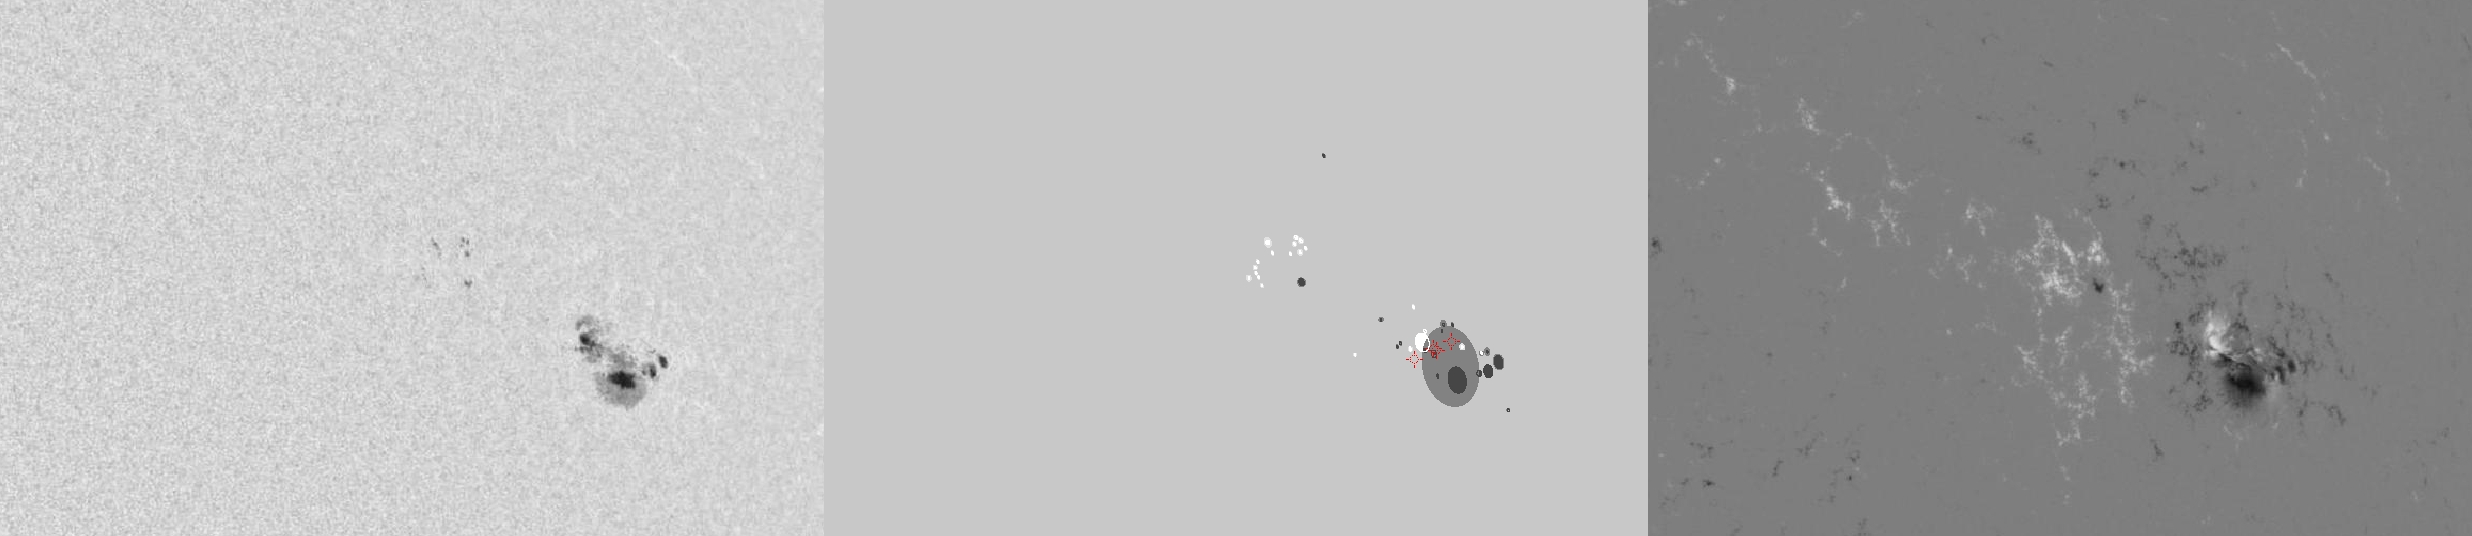
| Evolution of sunspot group NOAA 11283 and positions of flares in it animated by using the data of SDO/HMI Debrecen Data (HMIDD) sunspot catalogue (lower panel, middle, ellipses with positions and areas corresponding to the relevant data of spots in SDO and with grey-scale colour coding of the magnetic polarities corresponding to that of the magnetograms), SDO/HMI continuum images (lower panel, left) and magnetograms (lower panel, right), SDO/AIA images (upper panel, middle), GOES and RHESSI flare data (red and blue symbols) observed within the interval around the time of HMIDD data. |
|
When you want to zoom in on one of the images, simply move the mouse pointer over that image. |
 |
| Year | Month | Day | Hour | Min | Sec | NOAA | Proj.U | Proj.WS | Corr.U | Corr.WS | B | L | LCM | Pos.angle | r | MU | MP |
|---|---|---|---|---|---|---|---|---|---|---|---|---|---|---|---|---|---|
| 2011 | 09 | 09 | 02 | 59 | 07 | 11283 | 120 | 554 | 90 | 402 | 14.12 | 226.63 | 47.26 | 282.66 | 0.7320 | -366.5 | -233.0 |
| Flare | Date | Start | Peak | End | Dur [s] | Peak [c/s] | Total Counts | Energy [keV] | X pos [asec] | Y pos [asec] | Radial [asec] | B [deg] | L [deg] | Flags |
|---|---|---|---|---|---|---|---|---|---|---|---|---|---|---|
| 11090905 | 9-Sep-2011 | 02:32:08 | 02:33:42 | 02:40:32 | 504 | 30 | 37460 | 6-12 | 685 | 157 | 703 | 14.36 | 225.90 | A0 DF P1 |
| 11090906 | 9-Sep-2011 | 02:40:32 | 02:42:22 | 02:47:20 | 408 | 22 | 23040 | 6-12 | 685 | 158 | 703 | 14.42 | 225.84 | A0 DF P1 |
| 11090909 | 9-Sep-2011 | 02:59:32 | 03:00:26 | 03:02:00 | 148 | 40 | 13420 | 6-12 | 677 | 152 | 694 | 14.13 | 224.87 | A0 DF P1 |
| 11090910 | 9-Sep-2011 | 03:06:00 | 03:06:34 | 03:08:40 | 160 | 22 | 8400 | 6-12 | 701 | 163 | 719 | 14.59 | 227.14 | A0 DF P1 |
| Date | Start | Peak | End | Classification | B [deg] | LCM [deg] |
|---|---|---|---|---|---|---|
| No data |

