move the mouse pointer over that image.
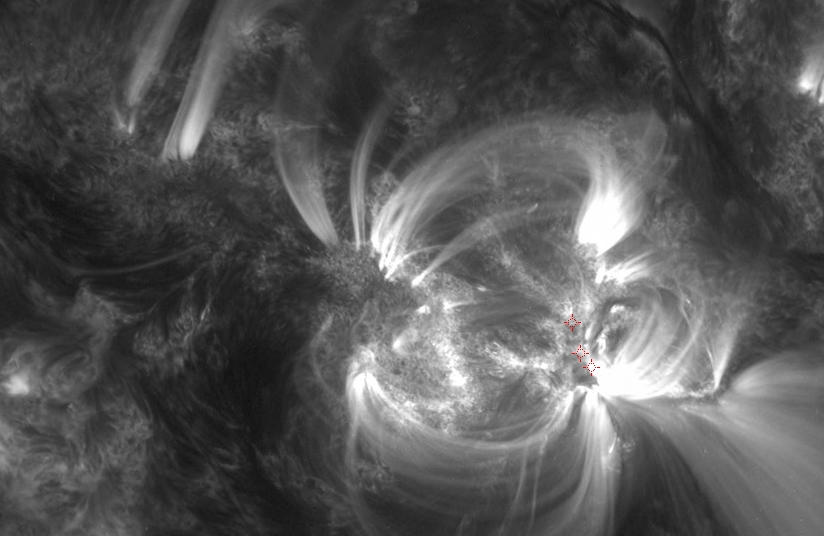
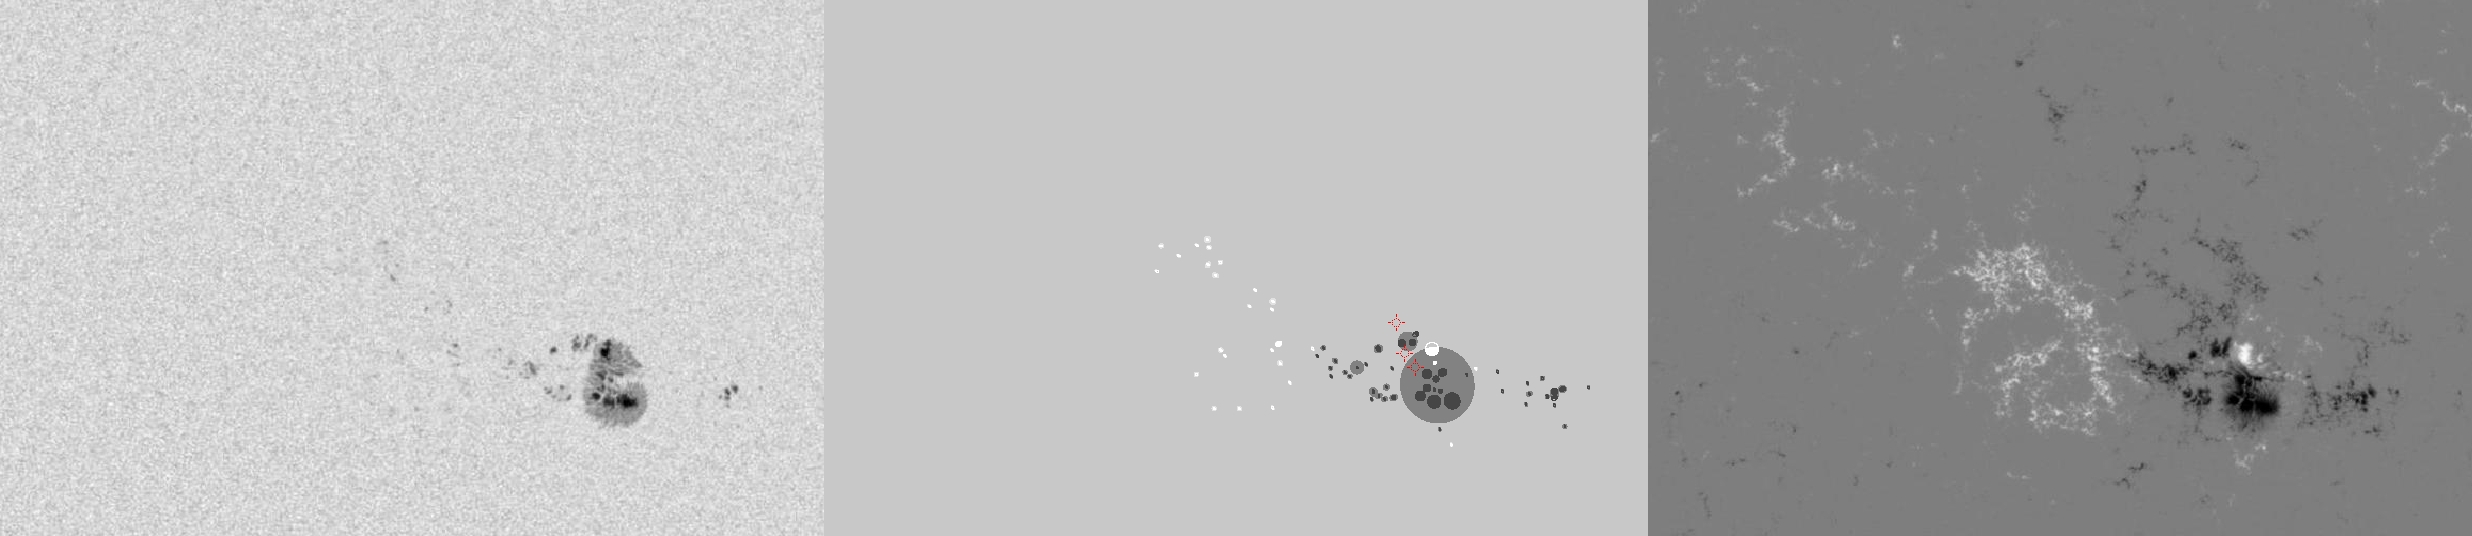
| Evolution of sunspot group NOAA 11283 and positions of flares in it animated by using the data of SDO/HMI Debrecen Data (HMIDD) sunspot catalogue (lower panel, middle, ellipses with positions and areas corresponding to the relevant data of spots in SDO and with grey-scale colour coding of the magnetic polarities corresponding to that of the magnetograms), SDO/HMI continuum images (lower panel, left) and magnetograms (lower panel, right), SDO/AIA images (upper panel, middle), GOES and RHESSI flare data (red and blue symbols) observed within the interval around the time of HMIDD data. |
|
When you want to zoom in on one of the images, simply move the mouse pointer over that image. |
 |
| Year | Month | Day | Hour | Min | Sec | NOAA | Proj.U | Proj.WS | Corr.U | Corr.WS | B | L | LCM | Pos.angle | r | MU | MP |
|---|---|---|---|---|---|---|---|---|---|---|---|---|---|---|---|---|---|
| 2011 | 09 | 06 | 18 | 59 | 07 | 11283 | 137 | 772 | 68 | 409 | 13.85 | 225.62 | 15.43 | 295.43 | 0.2880 | -738.7 | -323.5 |
| Flare | Date | Start | Peak | End | Dur [s] | Peak [c/s] | Total Counts | Energy [keV] | X pos [asec] | Y pos [asec] | Radial [asec] | B [deg] | L [deg] | Flags |
|---|---|---|---|---|---|---|---|---|---|---|---|---|---|---|
| 11090623 | 6-Sep-2011 | 18:35:48 | 18:38:06 | 18:42:08 | 380 | 256 | 179880 | 12-25 | 255 | 122 | 283 | 14.25 | 225.22 | A0 DF DR P1 PE |
| 11090675 | 6-Sep-2011 | 18:42:08 | 18:45:34 | 18:50:20 | 492 | 200 | 167280 | 6-12 | 245 | 150 | 288 | 15.95 | 224.64 | A0 DF DR P1 PE |
| 11090626 | 6-Sep-2011 | 18:50:20 | 18:55:06 | 19:14:04 | 1424 | 384 | 599400 | 6-12 | 253 | 131 | 285 | 14.79 | 224.98 | A0 DF DR P1 PE Q5 SD |
| Date | Start | Peak | End | Classification | B [deg] | LCM [deg] |
|---|---|---|---|---|---|---|
| No data |

