move the mouse pointer over that image.
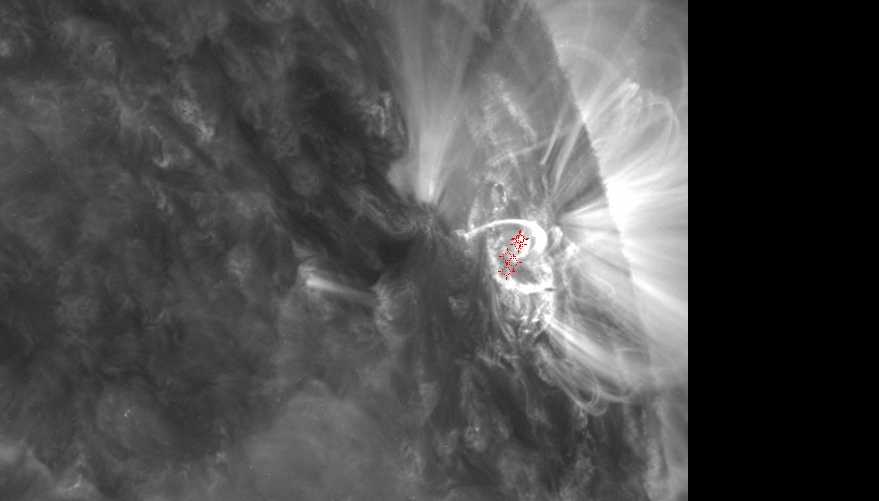
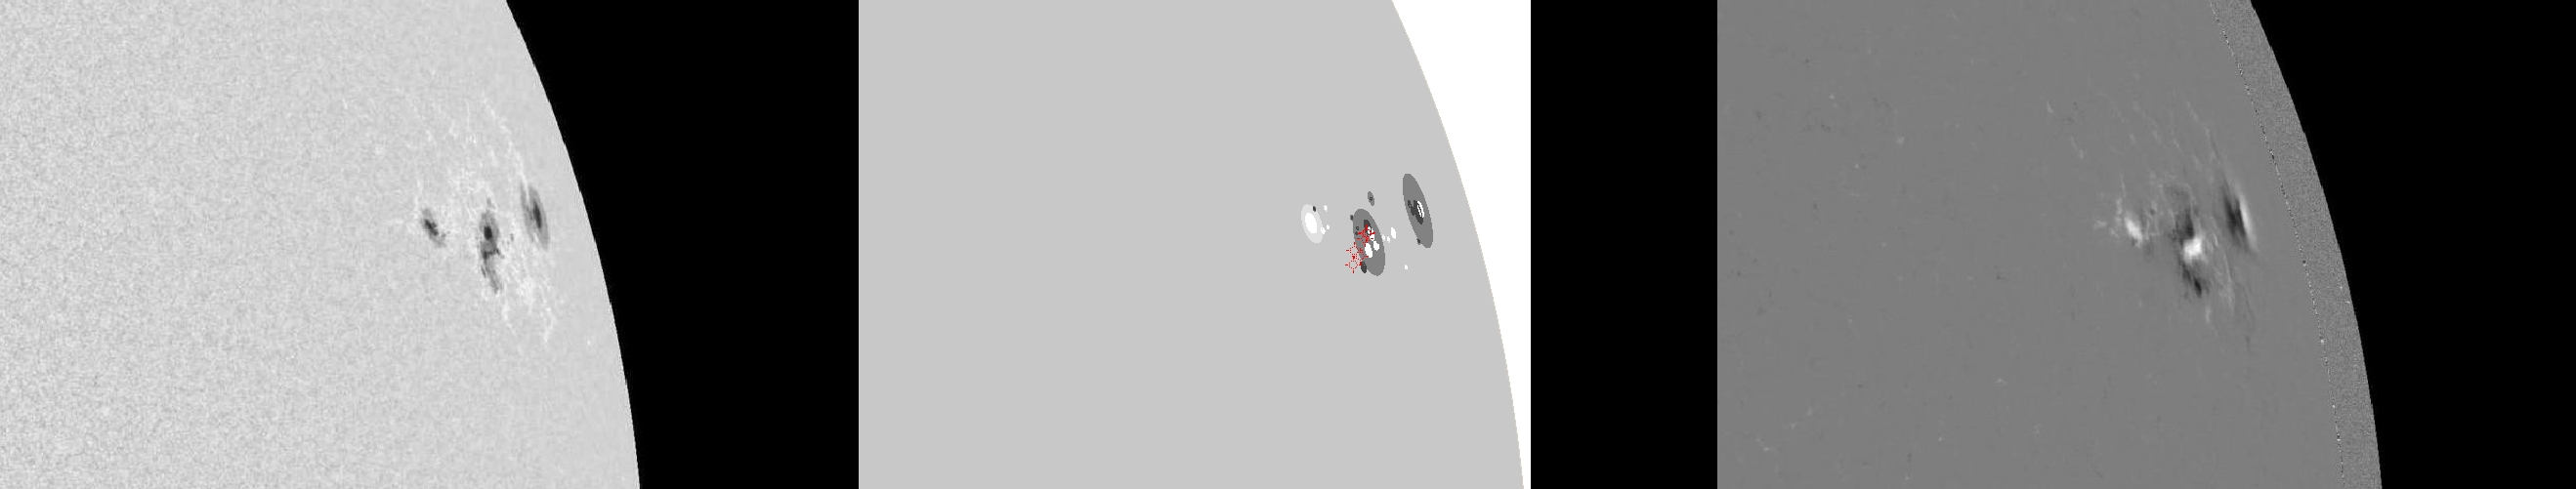
| Evolution of sunspot group NOAA 11263 and positions of flares in it animated by using the data of SDO/HMI Debrecen Data (HMIDD) sunspot catalogue (lower panel, middle, ellipses with positions and areas corresponding to the relevant data of spots in SDO and with grey-scale colour coding of the magnetic polarities corresponding to that of the magnetograms), SDO/HMI continuum images (lower panel, left) and magnetograms (lower panel, right), SDO/AIA images (upper panel, middle), GOES and RHESSI flare data (red and blue symbols) observed within the interval around the time of HMIDD data. |
|
When you want to zoom in on one of the images, simply move the mouse pointer over that image. |
 |
| Year | Month | Day | Hour | Min | Sec | NOAA | Proj.U | Proj.WS | Corr.U | Corr.WS | B | L | LCM | Pos.angle | r | MU | MP |
|---|---|---|---|---|---|---|---|---|---|---|---|---|---|---|---|---|---|
| 2011 | 08 | 09 | 05 | 59 | 11 | 11263 | 91 | 475 | 133 | 711 | 17.84 | 299.06 | 71.70 | 286.78 | 0.9426 | 55.2 | -54.4 |
| Flare | Date | Start | Peak | End | Dur [s] | Peak [c/s] | Total Counts | Energy [keV] | X pos [asec] | Y pos [asec] | Radial [asec] | B [deg] | L [deg] | Flags |
|---|---|---|---|---|---|---|---|---|---|---|---|---|---|---|
| 11080917 | 9-Aug-2011 | 05:37:56 | 05:39:58 | 05:41:28 | 212 | 44 | 36160 | 6-12 | 854 | 250 | 890 | 17.44 | 295.24 | A0 DR P1 |
| 11080974 | 9-Aug-2011 | 05:41:28 | 05:42:38 | 05:44:32 | 184 | 44 | 31080 | 6-12 | 855 | 254 | 892 | 17.65 | 295.57 | A0 |
| 11080918 | 9-Aug-2011 | 05:44:32 | 05:47:54 | 05:50:36 | 364 | 108 | 103360 | 6-12 | 848 | 243 | 883 | 17.13 | 293.91 | A0 |
| 11080919 | 9-Aug-2011 | 05:50:36 | 05:54:18 | 06:07:00 | 984 | 104 | 355880 | 6-12 | 856 | 254 | 893 | 17.63 | 295.62 | A0 DR P1 |
| 11080920 | 9-Aug-2011 | 06:07:00 | 06:09:10 | 06:10:40 | 220 | 84 | 68760 | 6-12 | 854 | 240 | 887 | 16.86 | 294.52 | A0 DR P1 PE |
| 11080921 | 9-Aug-2011 | 06:10:40 | 06:26:38 | 06:32:24 | 1304 | 416 | 782320 | 6-12 | 852 | 235 | 884 | 16.61 | 293.83 | A0 DR P1 PE |
| Date | Start | Peak | End | Classification | B [deg] | LCM [deg] |
|---|---|---|---|---|---|---|
| No data |

