move the mouse pointer over that image.
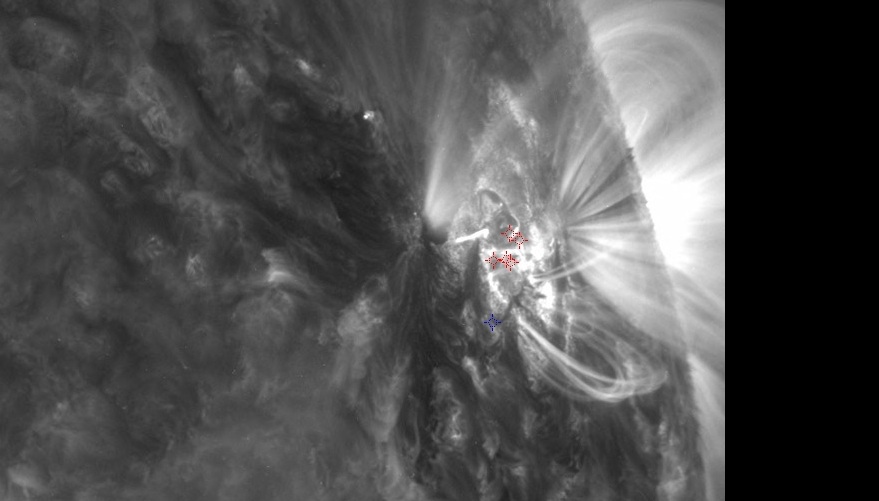
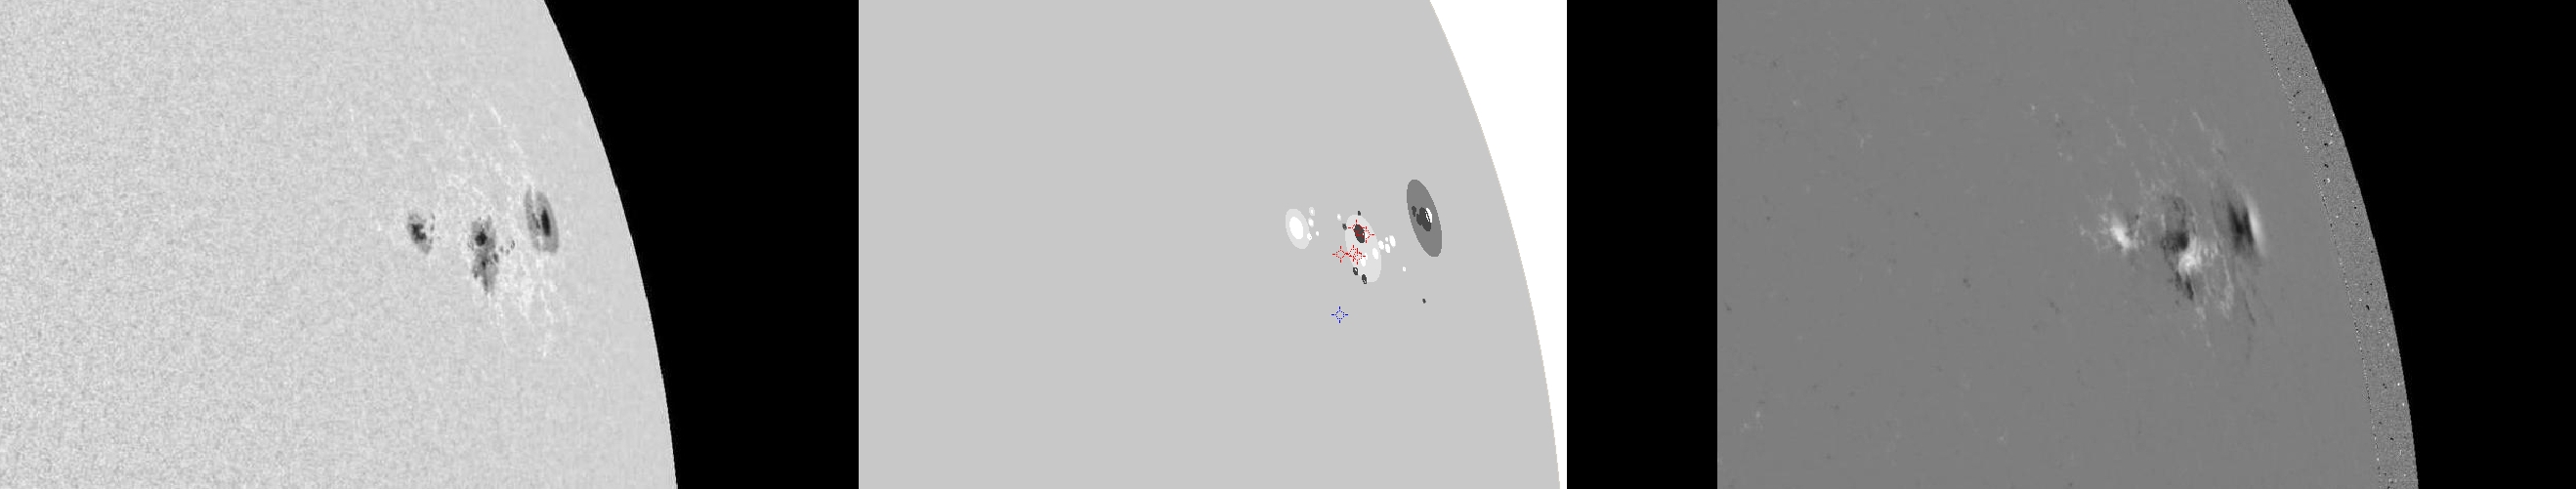
| Evolution of sunspot group NOAA 11263 and positions of flares in it animated by using the data of SDO/HMI Debrecen Data (HMIDD) sunspot catalogue (lower panel, middle, ellipses with positions and areas corresponding to the relevant data of spots in SDO and with grey-scale colour coding of the magnetic polarities corresponding to that of the magnetograms), SDO/HMI continuum images (lower panel, left) and magnetograms (lower panel, right), SDO/AIA images (upper panel, middle), GOES and RHESSI flare data (red and blue symbols) observed within the interval around the time of HMIDD data. |
|
When you want to zoom in on one of the images, simply move the mouse pointer over that image. |
 |
| Year | Month | Day | Hour | Min | Sec | NOAA | Proj.U | Proj.WS | Corr.U | Corr.WS | B | L | LCM | Pos.angle | r | MU | MP |
|---|---|---|---|---|---|---|---|---|---|---|---|---|---|---|---|---|---|
| 2011 | 08 | 08 | 21 | 59 | 10 | 11263 | 113 | 600 | 138 | 748 | 17.84 | 299.17 | 67.42 | 286.81 | 0.9171 | -54.0 | -13.1 |
| Flare | Date | Start | Peak | End | Dur [s] | Peak [c/s] | Total Counts | Energy [keV] | X pos [asec] | Y pos [asec] | Radial [asec] | B [deg] | L [deg] | Flags |
|---|---|---|---|---|---|---|---|---|---|---|---|---|---|---|
| 11080837 | 8-Aug-2011 | 21:39:08 | 21:40:18 | 21:42:16 | 188 | 4 | 1637 | 6-12 | 827 | 237 | 860 | 17.06 | 295.12 | A0 |
| 11080838 | 8-Aug-2011 | 21:44:44 | 21:46:06 | 21:47:32 | 168 | 3 | 1821 | 6-12 | 827 | 255 | 866 | 18.11 | 295.77 | A0 |
| 11080867 | 8-Aug-2011 | 21:47:32 | 21:49:10 | 21:52:28 | 296 | 4 | 3251 | 6-12 | 833 | 251 | 870 | 17.80 | 296.42 | A0 |
| 11080840 | 8-Aug-2011 | 22:00:12 | 22:07:42 | 22:13:08 | 776 | 464 | 886549 | 25-50 | 820 | 239 | 854 | 17.27 | 294.00 | a0 A1 DR P1 PE |
| 11080868 | 8-Aug-2011 | 22:13:08 | 22:14:58 | 22:21:08 | 480 | 200 | 194580 | 12-25 | 829 | 240 | 863 | 17.21 | 295.19 | a0 A1 DR P1 PE |
| Date | Start | Peak | End | Classification | B [deg] | LCM [deg] |
|---|---|---|---|---|---|---|
| 8-Aug-2011 | 22:00 | 22:09 | 22:20 | C7.7 | 15 | 61 |

