move the mouse pointer over that image.
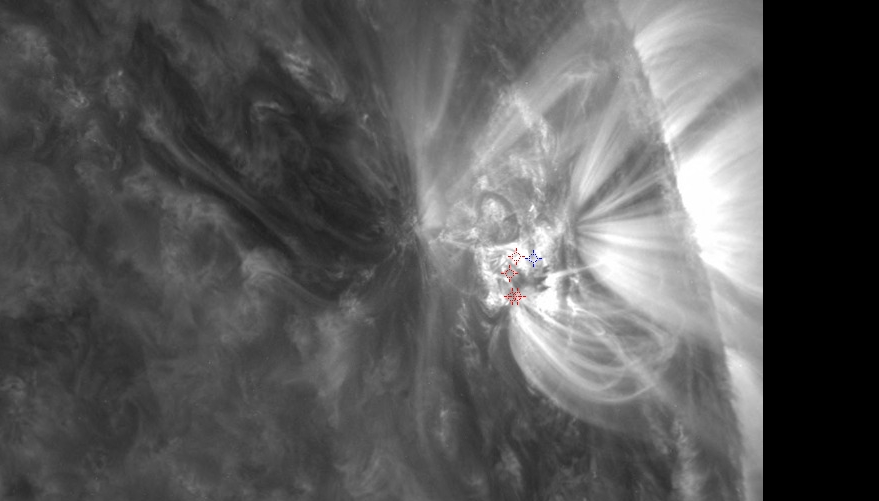
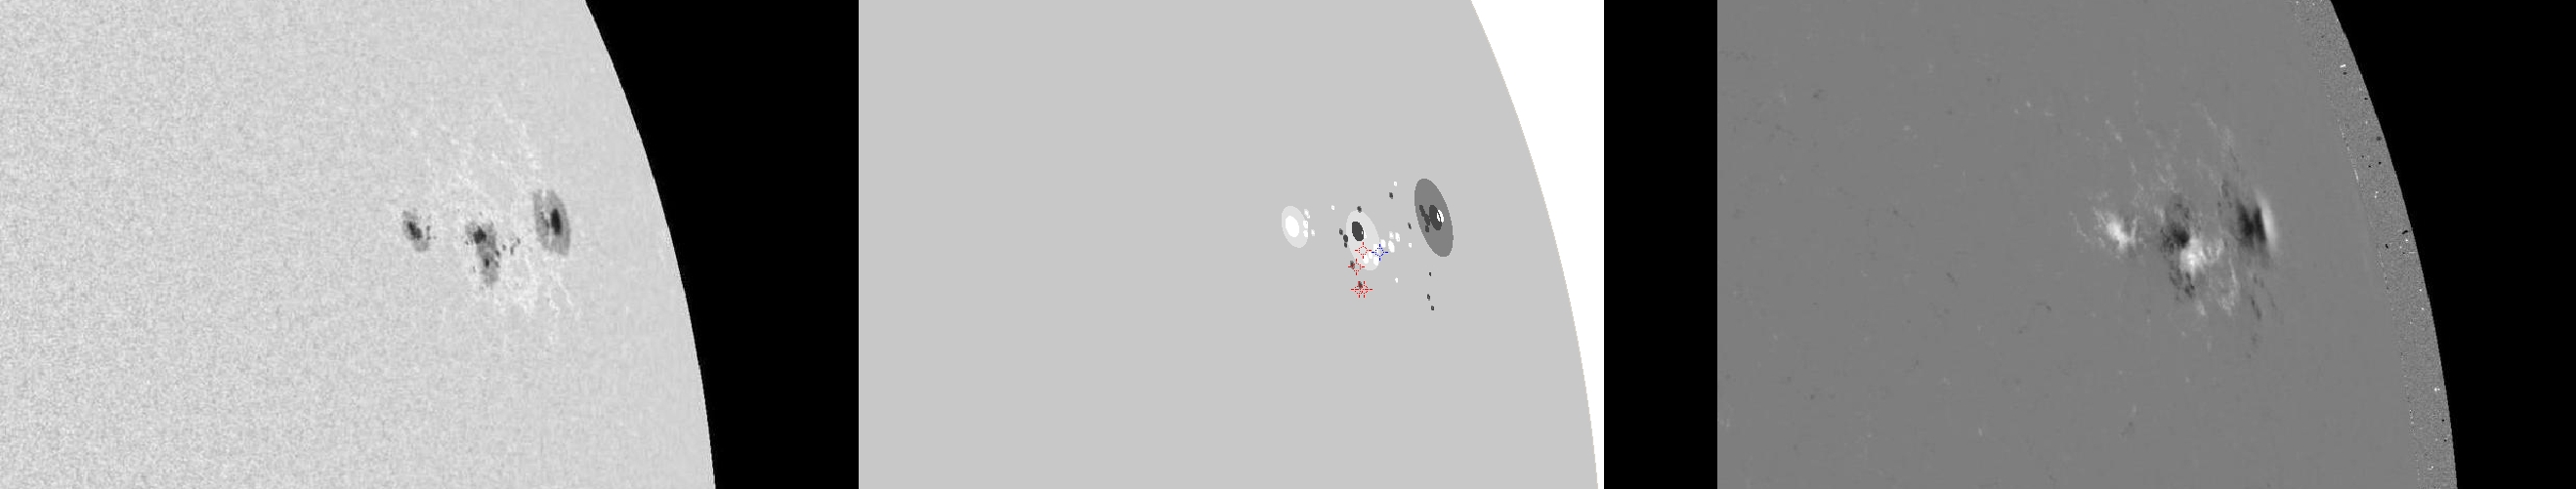
| Evolution of sunspot group NOAA 11263 and positions of flares in it animated by using the data of SDO/HMI Debrecen Data (HMIDD) sunspot catalogue (lower panel, middle, ellipses with positions and areas corresponding to the relevant data of spots in SDO and with grey-scale colour coding of the magnetic polarities corresponding to that of the magnetograms), SDO/HMI continuum images (lower panel, left) and magnetograms (lower panel, right), SDO/AIA images (upper panel, middle), GOES and RHESSI flare data (red and blue symbols) observed within the interval around the time of HMIDD data. |
|
When you want to zoom in on one of the images, simply move the mouse pointer over that image. |
 |
| Year | Month | Day | Hour | Min | Sec | NOAA | Proj.U | Proj.WS | Corr.U | Corr.WS | B | L | LCM | Pos.angle | r | MU | MP |
|---|---|---|---|---|---|---|---|---|---|---|---|---|---|---|---|---|---|
| 2011 | 08 | 08 | 15 | 59 | 10 | 11263 | 125 | 639 | 138 | 717 | 17.92 | 299.45 | 64.38 | 287.00 | 0.8962 | -105.2 | 15.3 |
| Flare | Date | Start | Peak | End | Dur [s] | Peak [c/s] | Total Counts | Energy [keV] | X pos [asec] | Y pos [asec] | Radial [asec] | B [deg] | L [deg] | Flags |
|---|---|---|---|---|---|---|---|---|---|---|---|---|---|---|
| 11080823 | 8-Aug-2011 | 15:24:40 | 15:35:18 | 15:43:16 | 1116 | 976 | 1588680 | 12-25 | 803 | 224 | 833 | 16.59 | 294.93 | A0 |
| 11080860 | 8-Aug-2011 | 15:43:16 | 15:44:42 | 15:44:56 | 100 | 120 | 38800 | 6-12 | 808 | 235 | 842 | 17.17 | 295.82 | A0 GE P1 PE |
| 11080825 | 8-Aug-2011 | 16:11:12 | 16:13:18 | 16:19:08 | 476 | 152 | 286480 | 6-12 | 813 | 211 | 840 | 15.71 | 295.42 | A0 |
| 11080861 | 8-Aug-2011 | 16:19:08 | 16:20:22 | 16:21:32 | 144 | 128 | 76160 | 6-12 | 811 | 211 | 838 | 15.73 | 295.10 | A0 |
| Date | Start | Peak | End | Classification | B [deg] | LCM [deg] |
|---|---|---|---|---|---|---|
| 8-Aug-2011 | 15:32 | 15:38 | 15:43 | B8.1 | 17 | 62 |

