move the mouse pointer over that image.
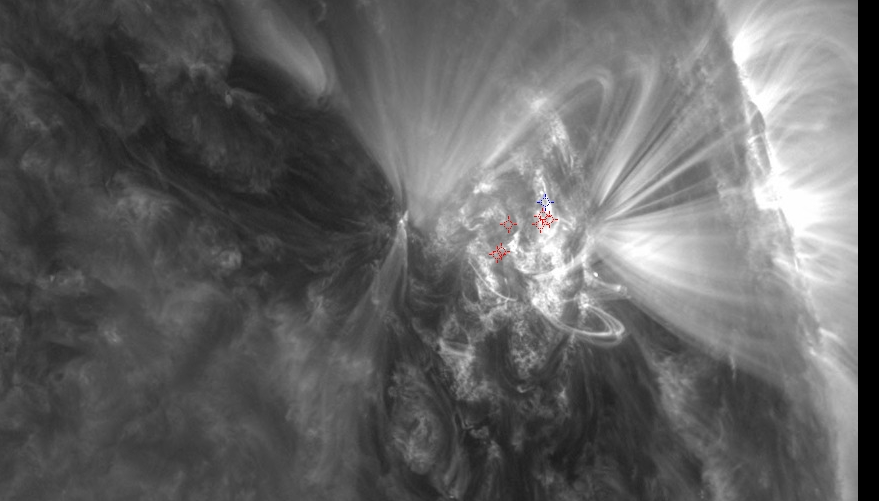
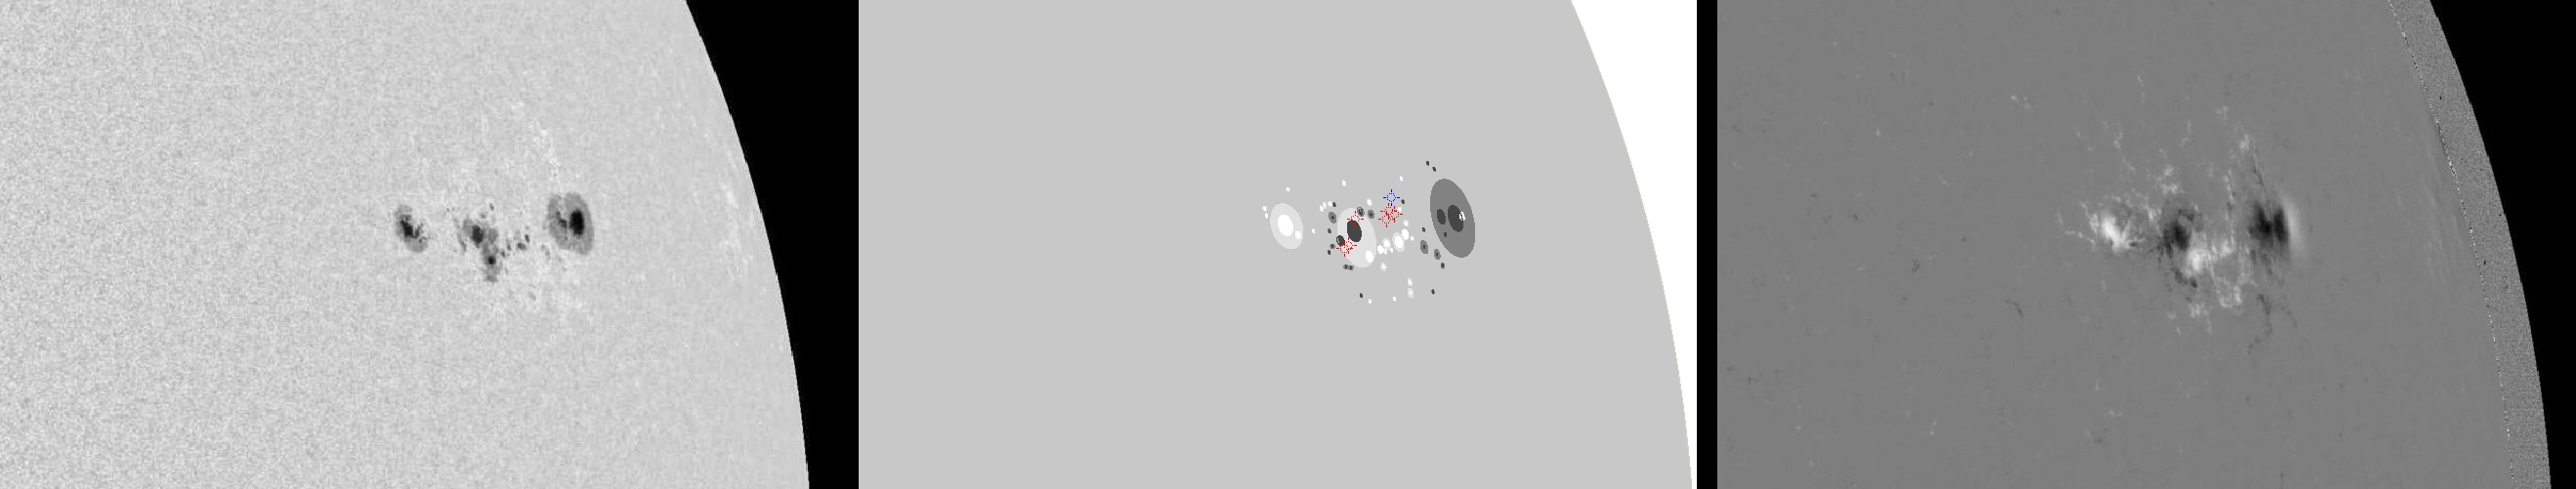
| Evolution of sunspot group NOAA 11263 and positions of flares in it animated by using the data of SDO/HMI Debrecen Data (HMIDD) sunspot catalogue (lower panel, middle, ellipses with positions and areas corresponding to the relevant data of spots in SDO and with grey-scale colour coding of the magnetic polarities corresponding to that of the magnetograms), SDO/HMI continuum images (lower panel, left) and magnetograms (lower panel, right), SDO/AIA images (upper panel, middle), GOES and RHESSI flare data (red and blue symbols) observed within the interval around the time of HMIDD data. |
|
When you want to zoom in on one of the images, simply move the mouse pointer over that image. |
 |
| Year | Month | Day | Hour | Min | Sec | NOAA | Proj.U | Proj.WS | Corr.U | Corr.WS | B | L | LCM | Pos.angle | r | MU | MP |
|---|---|---|---|---|---|---|---|---|---|---|---|---|---|---|---|---|---|
| 2011 | 08 | 08 | 02 | 59 | 11 | 11263 | 163 | 878 | 144 | 792 | 17.92 | 299.25 | 57.04 | 287.46 | 0.8364 | -173.7 | -44.0 |
| Flare | Date | Start | Peak | End | Dur [s] | Peak [c/s] | Total Counts | Energy [keV] | X pos [asec] | Y pos [asec] | Radial [asec] | B [deg] | L [deg] | Flags |
|---|---|---|---|---|---|---|---|---|---|---|---|---|---|---|
| 11080806 | 8-Aug-2011 | 02:30:48 | 02:31:50 | 02:32:48 | 120 | 34 | 15720 | 6-12 | 768 | 248 | 807 | 18.35 | 298.79 | A0 |
| 11080807 | 8-Aug-2011 | 02:33:40 | 02:35:02 | 02:36:00 | 140 | 112 | 40040 | 6-12 | 737 | 226 | 771 | 17.33 | 294.85 | A0 |
| 11080850 | 8-Aug-2011 | 02:36:00 | 02:37:30 | 02:39:28 | 208 | 184 | 81760 | 6-12 | 740 | 228 | 775 | 17.42 | 295.18 | A0 |
| 11080809 | 8-Aug-2011 | 02:57:44 | 03:09:42 | 03:16:24 | 1120 | 2800 | 2540760 | 12-25 | 770 | 251 | 810 | 18.51 | 298.76 | A0 DR P1 PE |
| 11080851 | 8-Aug-2011 | 03:16:24 | 03:18:46 | 03:23:44 | 440 | 1328 | 473640 | 12-25 | 770 | 246 | 809 | 18.21 | 298.52 | A0 DR P1 |
| 11080811 | 8-Aug-2011 | 03:24:40 | 03:26:02 | 03:29:08 | 268 | 120 | 74200 | 6-12 | 752 | 246 | 792 | 18.39 | 296.48 | A0 |
| Date | Start | Peak | End | Classification | B [deg] | LCM [deg] |
|---|---|---|---|---|---|---|
| 8-Aug-2011 | 03:00 | 03:10 | 03:14 | C1.3 | 19 | 57 |

