move the mouse pointer over that image.
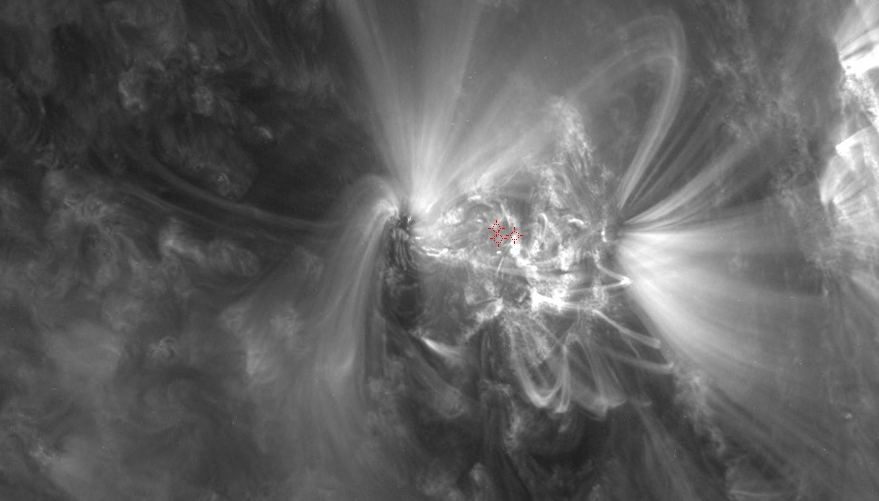
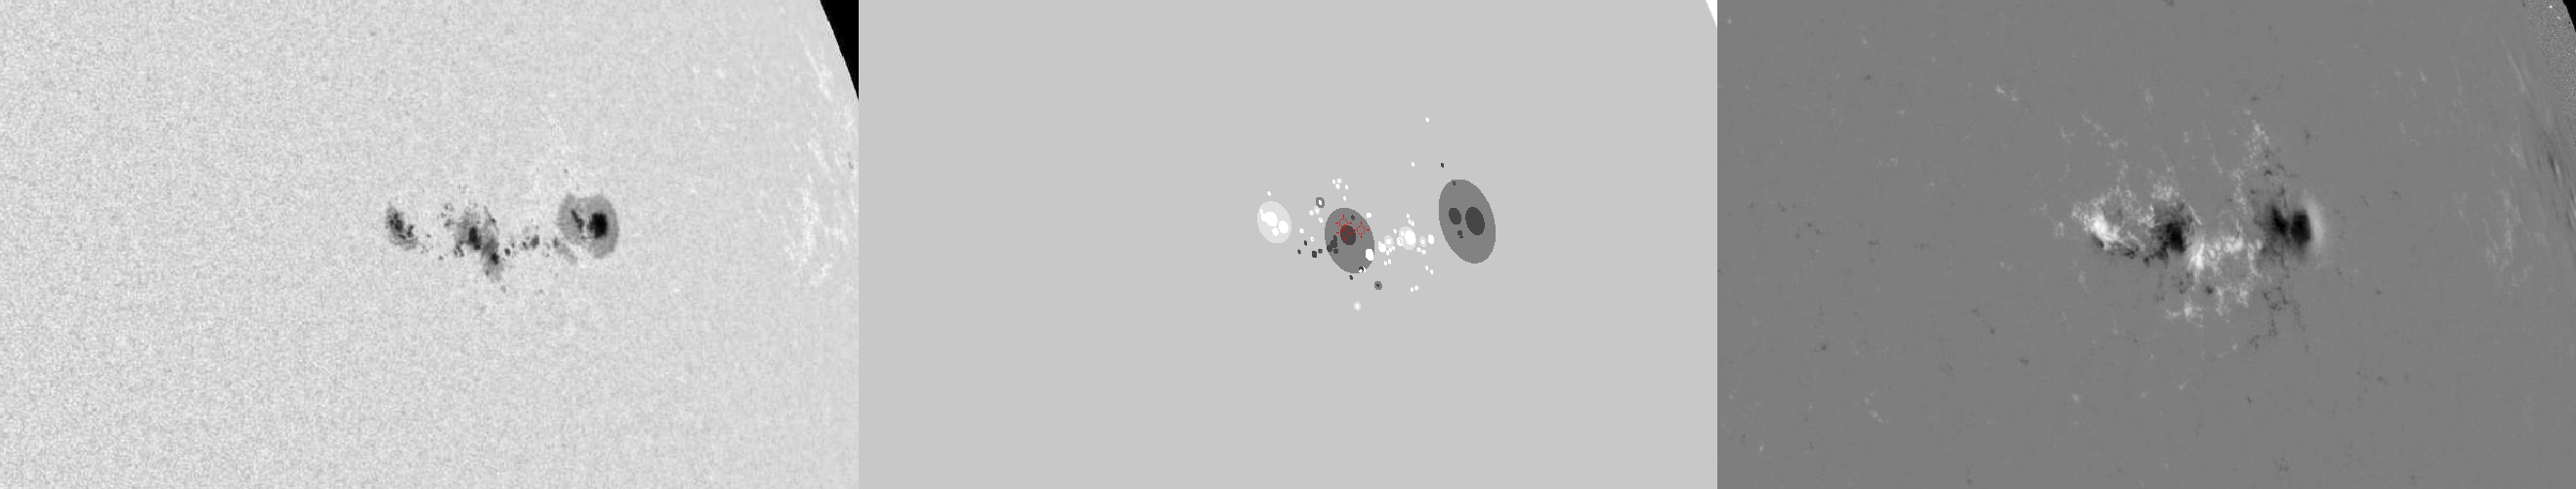
| Evolution of sunspot group NOAA 11263 and positions of flares in it animated by using the data of SDO/HMI Debrecen Data (HMIDD) sunspot catalogue (lower panel, middle, ellipses with positions and areas corresponding to the relevant data of spots in SDO and with grey-scale colour coding of the magnetic polarities corresponding to that of the magnetograms), SDO/HMI continuum images (lower panel, left) and magnetograms (lower panel, right), SDO/AIA images (upper panel, middle), GOES and RHESSI flare data (red and blue symbols) observed within the interval around the time of HMIDD data. |
|
When you want to zoom in on one of the images, simply move the mouse pointer over that image. |
 |
| Year | Month | Day | Hour | Min | Sec | NOAA | Proj.U | Proj.WS | Corr.U | Corr.WS | B | L | LCM | Pos.angle | r | MU | MP |
|---|---|---|---|---|---|---|---|---|---|---|---|---|---|---|---|---|---|
| 2011 | 08 | 07 | 11 | 59 | 11 | 11263 | 206 | 1129 | 155 | 858 | 17.89 | 299.40 | 48.89 | 288.48 | 0.7561 | -250.2 | -99.1 |
| Flare | Date | Start | Peak | End | Dur [s] | Peak [c/s] | Total Counts | Energy [keV] | X pos [asec] | Y pos [asec] | Radial [asec] | B [deg] | L [deg] | Flags |
|---|---|---|---|---|---|---|---|---|---|---|---|---|---|---|
| 11080744 | 7-Aug-2011 | 12:06:48 | 12:07:42 | 12:10:56 | 248 | 46 | 42740 | 6-12 | 664 | 227 | 702 | 17.92 | 295.91 | A0 DR P1 |
| 11080780 | 7-Aug-2011 | 12:10:56 | 12:12:38 | 12:14:44 | 228 | 52 | 39920 | 6-12 | 675 | 229 | 713 | 17.96 | 296.89 | A0 DR P1 |
| 11080745 | 7-Aug-2011 | 12:14:44 | 12:17:58 | 12:25:52 | 668 | 52 | 103520 | 6-12 | 665 | 234 | 705 | 18.33 | 296.05 | A0 DR P1 |
| Date | Start | Peak | End | Classification | B [deg] | LCM [deg] |
|---|---|---|---|---|---|---|
| No data |

