move the mouse pointer over that image.
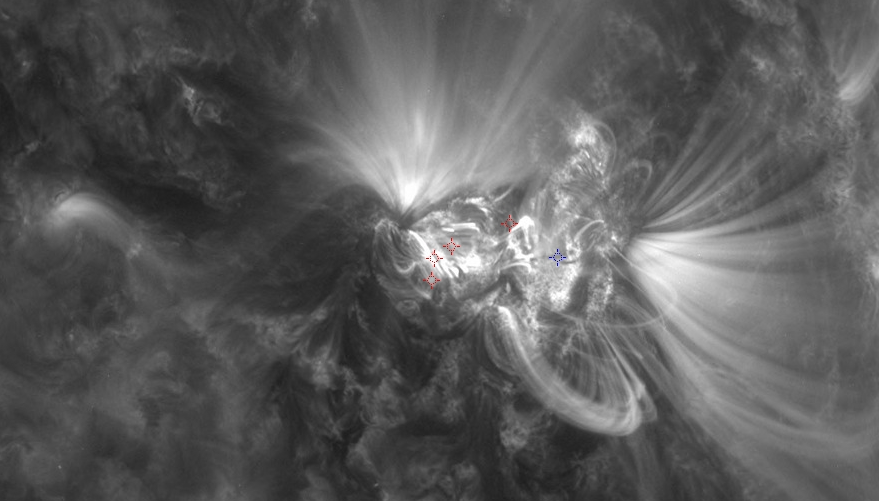
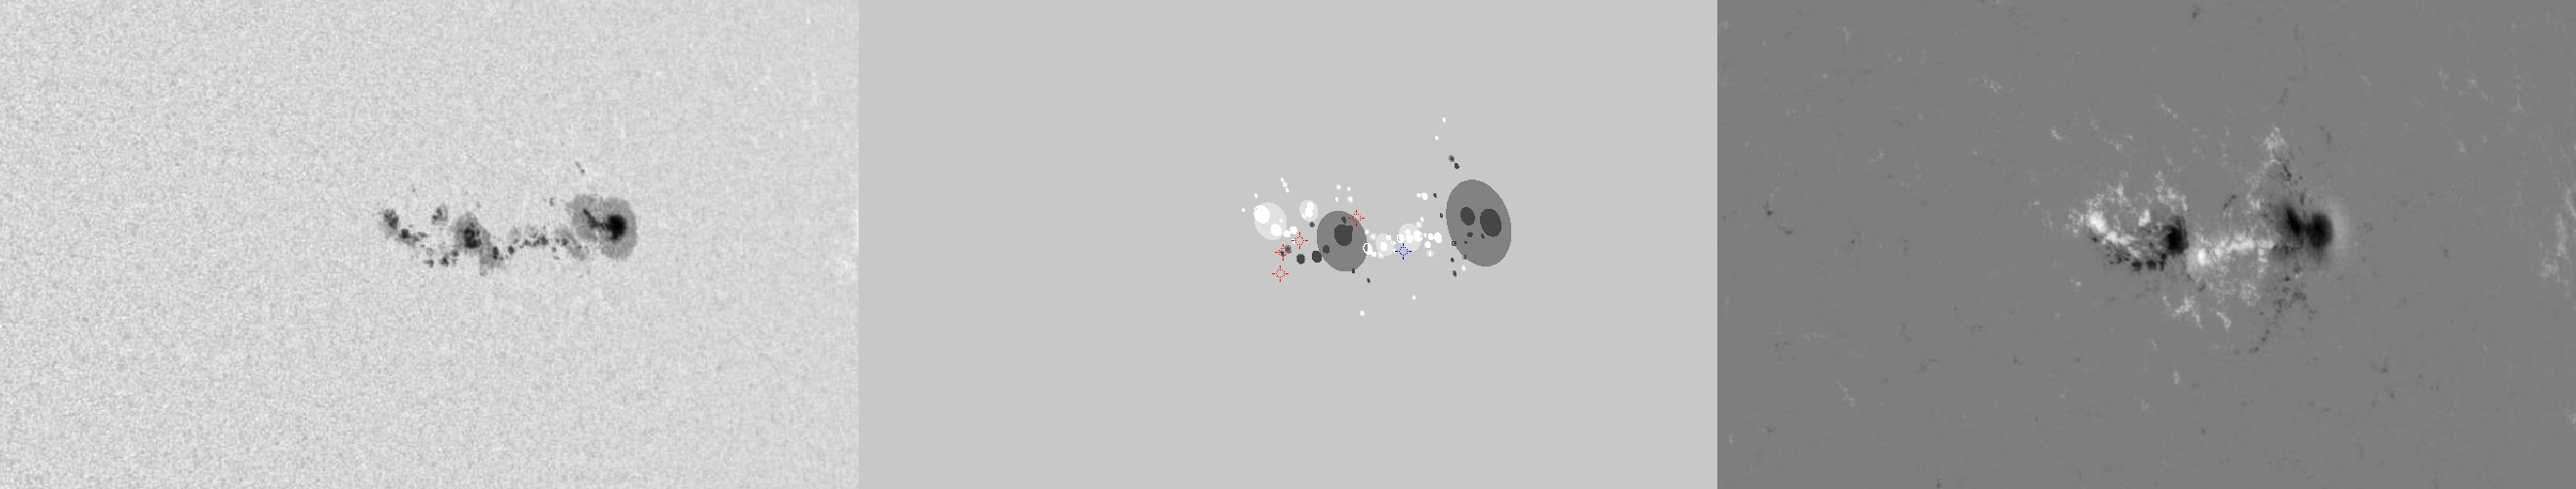
| Evolution of sunspot group NOAA 11263 and positions of flares in it animated by using the data of SDO/HMI Debrecen Data (HMIDD) sunspot catalogue (lower panel, middle, ellipses with positions and areas corresponding to the relevant data of spots in SDO and with grey-scale colour coding of the magnetic polarities corresponding to that of the magnetograms), SDO/HMI continuum images (lower panel, left) and magnetograms (lower panel, right), SDO/AIA images (upper panel, middle), GOES and RHESSI flare data (red and blue symbols) observed within the interval around the time of HMIDD data. |
|
When you want to zoom in on one of the images, simply move the mouse pointer over that image. |
 |
| Year | Month | Day | Hour | Min | Sec | NOAA | Proj.U | Proj.WS | Corr.U | Corr.WS | B | L | LCM | Pos.angle | r | MU | MP |
|---|---|---|---|---|---|---|---|---|---|---|---|---|---|---|---|---|---|
| 2011 | 08 | 06 | 23 | 59 | 11 | 11263 | 282 | 1282 | 189 | 871 | 17.88 | 299.68 | 42.59 | 289.81 | 0.6849 | -222.2 | -135.0 |
| Flare | Date | Start | Peak | End | Dur [s] | Peak [c/s] | Total Counts | Energy [keV] | X pos [asec] | Y pos [asec] | Radial [asec] | B [deg] | L [deg] | Flags |
|---|---|---|---|---|---|---|---|---|---|---|---|---|---|---|
| 11080654 | 6-Aug-2011 | 23:30:16 | 23:33:46 | 23:40:28 | 612 | 96 | 126200 | 6-12 | 554 | 214 | 594 | 17.74 | 293.51 | A0 |
| 11080682 | 6-Aug-2011 | 23:40:28 | 23:42:38 | 23:43:28 | 180 | 28 | 21240 | 6-12 | 592 | 229 | 635 | 18.45 | 296.68 | A0 |
| 11080701 | 7-Aug-2011 | 00:16:16 | 00:20:30 | 00:23:04 | 408 | 528 | 479120 | 12-25 | 553 | 194 | 586 | 16.54 | 292.72 | A0 P1 Q2 SD |
| 11080766 | 7-Aug-2011 | 00:23:04 | 00:23:06 | 00:26:00 | 176 | 200 | 100160 | 6-12 | 555 | 208 | 593 | 17.37 | 293.05 | A0 GE P1 Q3 SD |
| Date | Start | Peak | End | Classification | B [deg] | LCM [deg] |
|---|---|---|---|---|---|---|
| 7-Aug-2011 | 00:17 | 00:21 | 00:27 | B7.6 | 17 | 42 |

