move the mouse pointer over that image.
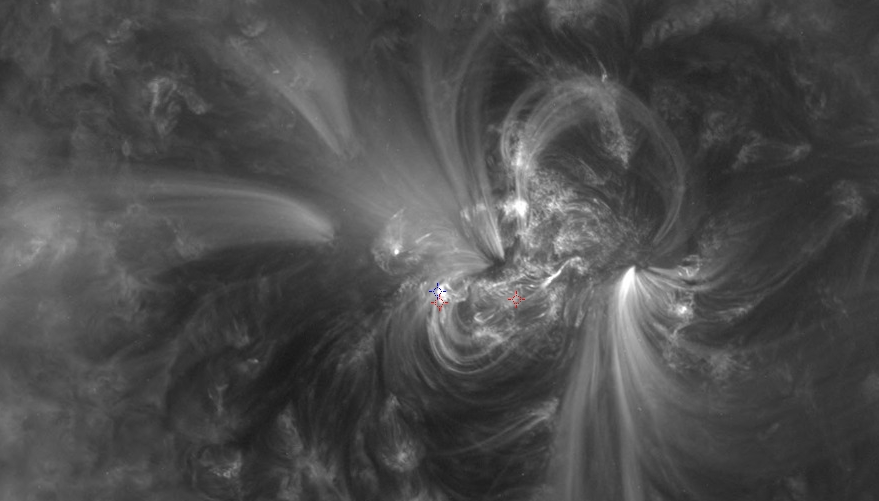
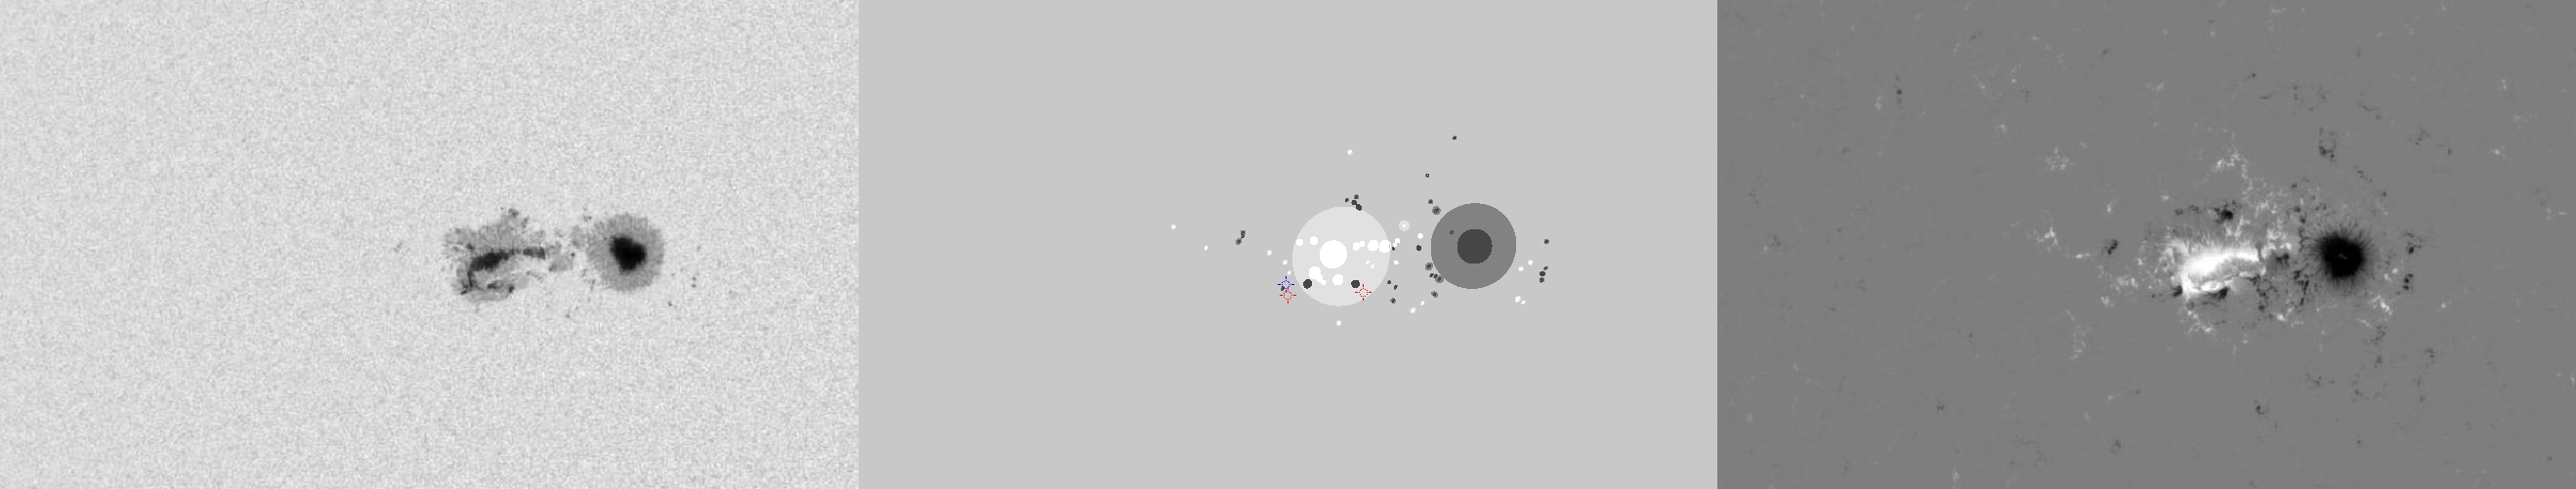
| Evolution of sunspot group NOAA 11263 and positions of flares in it animated by using the data of SDO/HMI Debrecen Data (HMIDD) sunspot catalogue (lower panel, middle, ellipses with positions and areas corresponding to the relevant data of spots in SDO and with grey-scale colour coding of the magnetic polarities corresponding to that of the magnetograms), SDO/HMI continuum images (lower panel, left) and magnetograms (lower panel, right), SDO/AIA images (upper panel, middle), GOES and RHESSI flare data (red and blue symbols) observed within the interval around the time of HMIDD data. |
|
When you want to zoom in on one of the images, simply move the mouse pointer over that image. |
 |
| Year | Month | Day | Hour | Min | Sec | NOAA | Proj.U | Proj.WS | Corr.U | Corr.WS | B | L | LCM | Pos.angle | r | MU | MP |
|---|---|---|---|---|---|---|---|---|---|---|---|---|---|---|---|---|---|
| 2011 | 08 | 02 | 11 | 59 | 11 | 11263 | 319 | 1936 | 168 | 1020 | 17.33 | 301.28 | -15.34 | 50.66 | 0.3266 | 3.7 | -0.1 |
| Flare | Date | Start | Peak | End | Dur [s] | Peak [c/s] | Total Counts | Energy [keV] | X pos [asec] | Y pos [asec] | Radial [asec] | B [deg] | L [deg] | Flags |
|---|---|---|---|---|---|---|---|---|---|---|---|---|---|---|
| 11080244 | 2-Aug-2011 | 11:37:48 | 11:38:46 | 11:41:36 | 228 | 96 | 55782 | 12-25 | -303 | 169 | 347 | 15.58 | 296.73 | a0 A1 DR GS P1 |
| 11080245 | 2-Aug-2011 | 11:48:36 | 11:50:58 | 11:53:08 | 272 | 52 | 50020 | 6-12 | -251 | 171 | 304 | 15.80 | 299.97 | A0 DR EE P1 |
| Date | Start | Peak | End | Classification | B [deg] | LCM [deg] |
|---|---|---|---|---|---|---|
| 2-Aug-2011 | 11:36 | 11:39 | 11:42 | C2.0 | 16 | -20 |

