move the mouse pointer over that image.
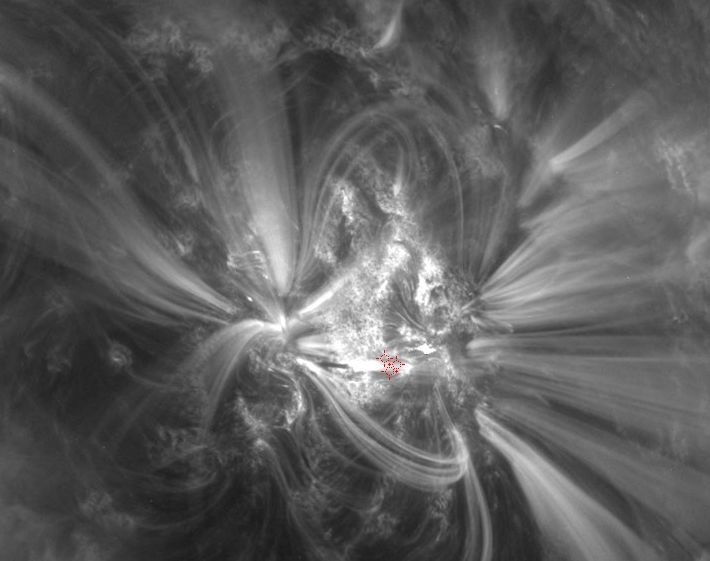
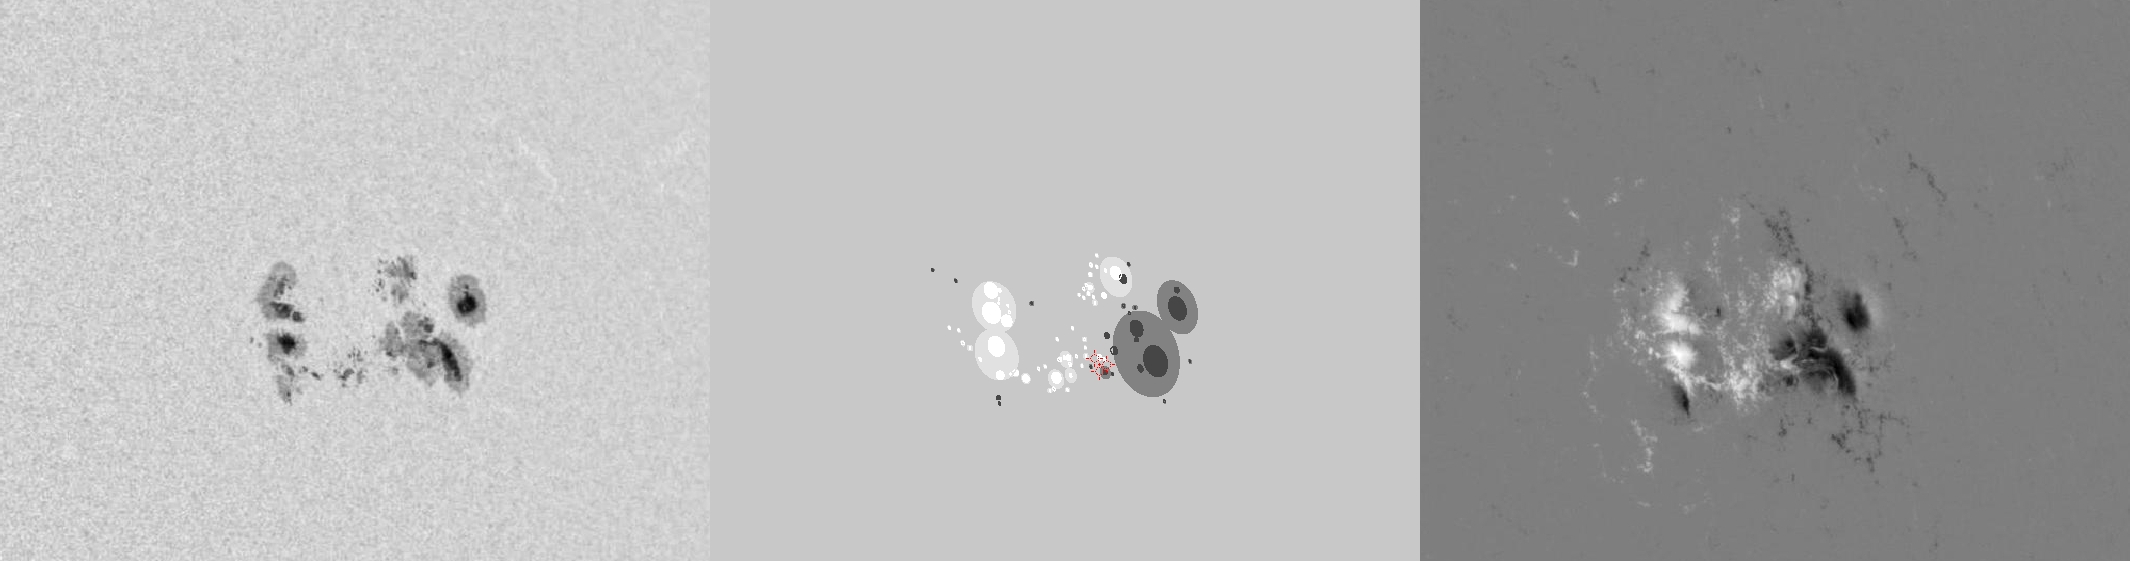
| Evolution of sunspot group NOAA 11166 and positions of flares in it animated by using the data of SDO/HMI Debrecen Data (HMIDD) sunspot catalogue (lower panel, middle, ellipses with positions and areas corresponding to the relevant data of spots in SDO and with grey-scale colour coding of the magnetic polarities corresponding to that of the magnetograms), SDO/HMI continuum images (lower panel, left) and magnetograms (lower panel, right), SDO/AIA images (upper panel, middle), GOES and RHESSI flare data (red and blue symbols) observed within the interval around the time of HMIDD data. |
|
When you want to zoom in on one of the images, simply move the mouse pointer over that image. |
 |
| Year | Month | Day | Hour | Min | Sec | NOAA | Proj.U | Proj.WS | Corr.U | Corr.WS | B | L | LCM | Pos.angle | r | MU | MP |
|---|---|---|---|---|---|---|---|---|---|---|---|---|---|---|---|---|---|
| 2011 | 03 | 12 | 03 | 59 | 00 | 11166 | 347 | 1556 | 235 | 1066 | 9.23 | 91.73 | 40.40 | 291.73 | 0.6896 | -53.0 | -58.0 |
| Flare | Date | Start | Peak | End | Dur [s] | Peak [c/s] | Total Counts | Energy [keV] | X pos [asec] | Y pos [asec] | Radial [asec] | B [deg] | L [deg] | Flags |
|---|---|---|---|---|---|---|---|---|---|---|---|---|---|---|
| 11031259 | 12-Mar-2011 | 03:37:00 | 03:37:18 | 03:38:24 | 84 | 15 | 5887 | 6-12 | 618 | 227 | 658 | 8.18 | 90.94 | A0 DF DR P1 |
| 11031208 | 12-Mar-2011 | 04:10:48 | 04:12:50 | 04:15:20 | 272 | 41 | 37055 | 6-12 | 629 | 218 | 666 | 7.70 | 91.44 | A0 DF DR P1 |
| 11031260 | 12-Mar-2011 | 04:15:20 | 04:16:18 | 04:17:56 | 156 | 22 | 15795 | 6-12 | 634 | 222 | 671 | 7.98 | 91.84 | A0 DF DR P1 PE |
| Date | Start | Peak | End | Classification | B [deg] | LCM [deg] |
|---|---|---|---|---|---|---|
| No data |

