move the mouse pointer over that image.
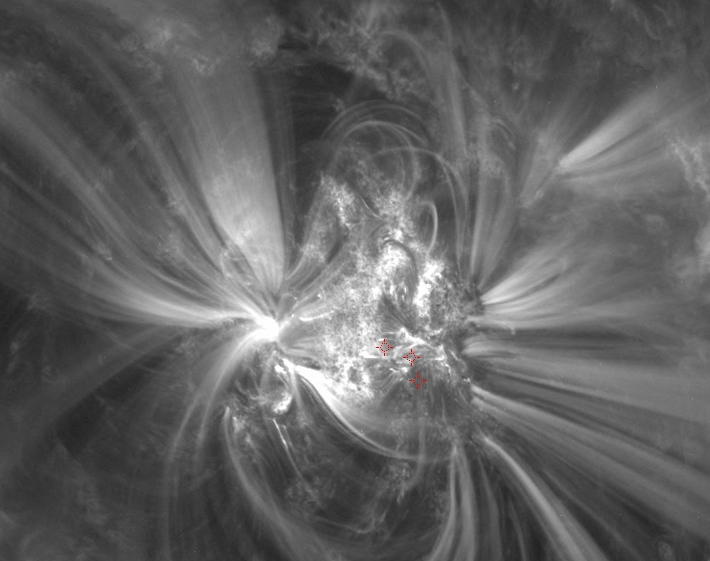
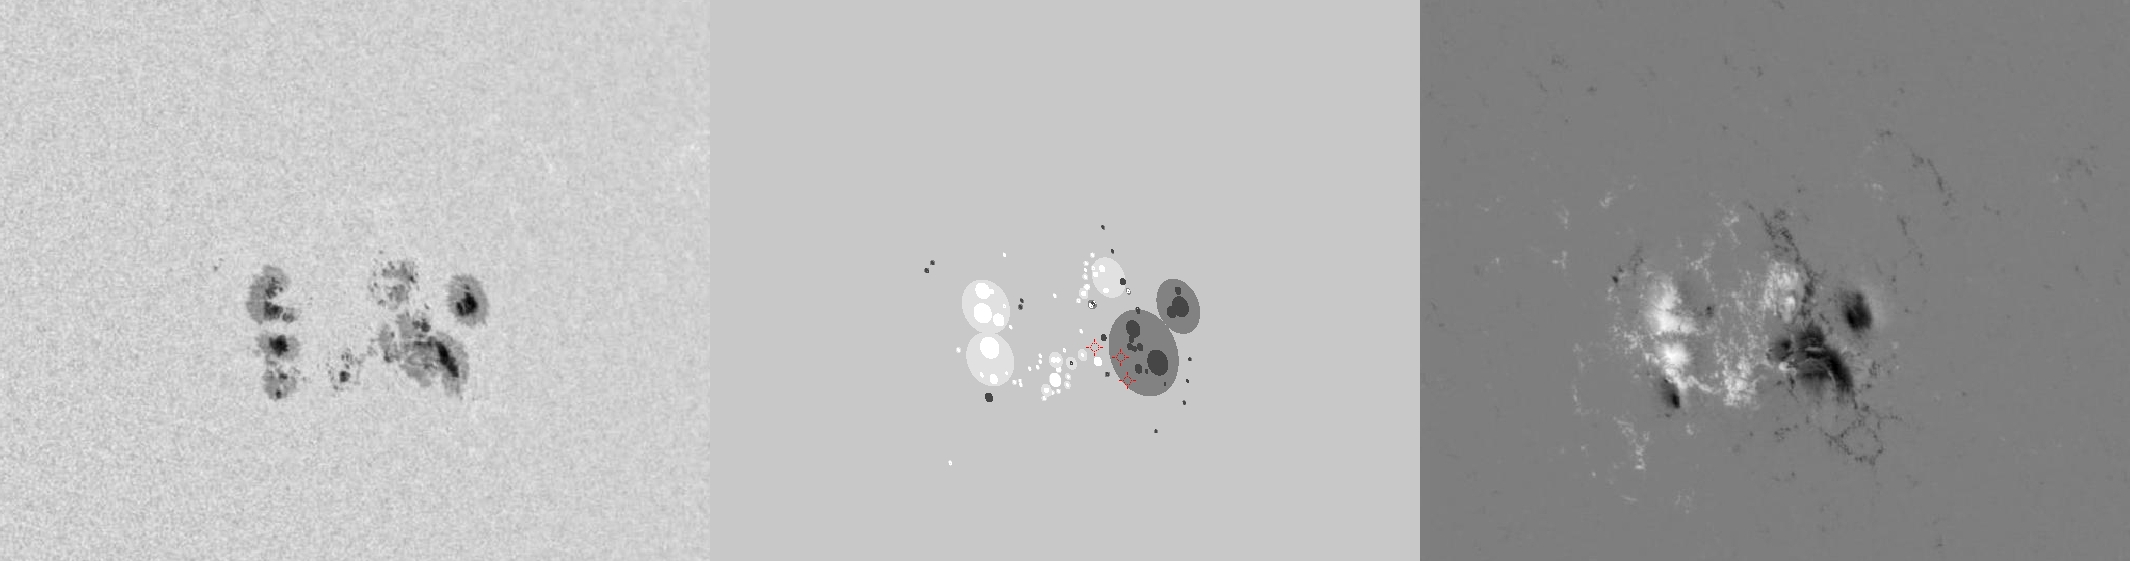
| Evolution of sunspot group NOAA 11166 and positions of flares in it animated by using the data of SDO/HMI Debrecen Data (HMIDD) sunspot catalogue (lower panel, middle, ellipses with positions and areas corresponding to the relevant data of spots in SDO and with grey-scale colour coding of the magnetic polarities corresponding to that of the magnetograms), SDO/HMI continuum images (lower panel, left) and magnetograms (lower panel, right), SDO/AIA images (upper panel, middle), GOES and RHESSI flare data (red and blue symbols) observed within the interval around the time of HMIDD data. |
|
When you want to zoom in on one of the images, simply move the mouse pointer over that image. |
 |
| Year | Month | Day | Hour | Min | Sec | NOAA | Proj.U | Proj.WS | Corr.U | Corr.WS | B | L | LCM | Pos.angle | r | MU | MP |
|---|---|---|---|---|---|---|---|---|---|---|---|---|---|---|---|---|---|
| 2011 | 03 | 11 | 22 | 59 | 00 | 11166 | 315 | 1674 | 205 | 1097 | 9.23 | 91.60 | 37.53 | 293.32 | 0.6556 | -45.4 | -69.1 |
| Flare | Date | Start | Peak | End | Dur [s] | Peak [c/s] | Total Counts | Energy [keV] | X pos [asec] | Y pos [asec] | Radial [asec] | B [deg] | L [deg] | Flags |
|---|---|---|---|---|---|---|---|---|---|---|---|---|---|---|
| 11031161 | 11-Mar-2011 | 22:30:40 | 22:31:06 | 22:35:56 | 316 | 20 | 29784 | 6-12 | 604 | 217 | 642 | 7.46 | 92.56 | A0 DF DR P1 |
| 11031176 | 11-Mar-2011 | 22:35:56 | 22:41:14 | 22:58:56 | 1380 | 160 | 368208 | 12-25 | 586 | 238 | 633 | 8.65 | 91.22 | A0 DF DR P1 |
| 11031162 | 11-Mar-2011 | 22:58:56 | 23:01:34 | 23:11:44 | 768 | 38 | 78912 | 6-12 | 607 | 231 | 649 | 8.35 | 92.62 | A0 DF DR P1 |
| Date | Start | Peak | End | Classification | B [deg] | LCM [deg] |
|---|---|---|---|---|---|---|
| No data |

