move the mouse pointer over that image.
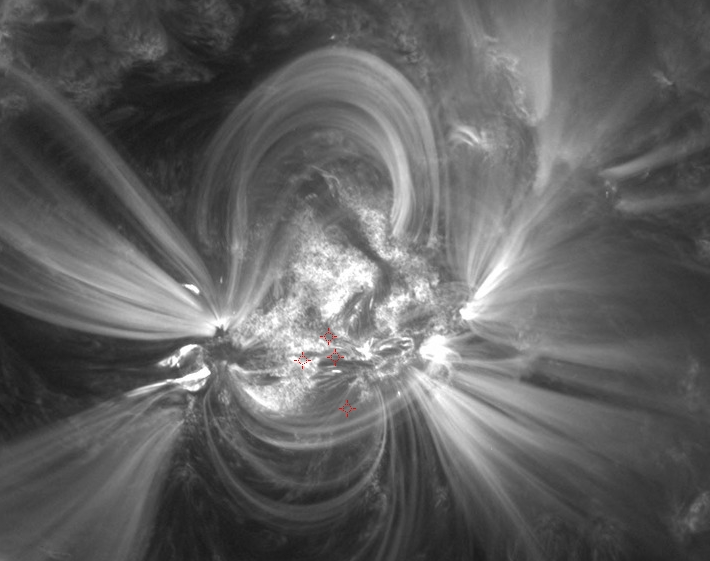
| Evolution of sunspot group NOAA 11166 and positions of flares in it animated by using the data of SDO/HMI Debrecen Data (HMIDD) sunspot catalogue (lower panel, middle, ellipses with positions and areas corresponding to the relevant data of spots in SDO and with grey-scale colour coding of the magnetic polarities corresponding to that of the magnetograms), SDO/HMI continuum images (lower panel, left) and magnetograms (lower panel, right), SDO/AIA images (upper panel, middle), GOES and RHESSI flare data (red and blue symbols) observed within the interval around the time of HMIDD data. |
|
When you want to zoom in on one of the images, simply move the mouse pointer over that image. |
 |
| Year | Month | Day | Hour | Min | Sec | NOAA | Proj.U | Proj.WS | Corr.U | Corr.WS | B | L | LCM | Pos.angle | r | MU | MP |
|---|---|---|---|---|---|---|---|---|---|---|---|---|---|---|---|---|---|
| 2011 | 03 | 10 | 02 | 59 | 00 | 11166 | 369 | 2057 | 196 | 1096 | 8.87 | 91.00 | 12.77 | 322.37 | 0.3548 | -143.8 | -21.0 |
| Flare | Date | Start | Peak | End | Dur [s] | Peak [c/s] | Total Counts | Energy [keV] | X pos [asec] | Y pos [asec] | Radial [asec] | B [deg] | L [deg] | Flags |
|---|---|---|---|---|---|---|---|---|---|---|---|---|---|---|
| 11031011 | 10-Mar-2011 | 02:36:44 | 02:40:30 | 02:42:48 | 364 | 128 | 113400 | 6-12 | 213 | 266 | 341 | 8.98 | 90.30 | A0 DF DR P1 |
| 11031074 | 10-Mar-2011 | 02:42:48 | 02:43:58 | 02:46:48 | 240 | 52 | 33792 | 6-12 | 218 | 253 | 334 | 8.18 | 90.55 | A0 DF DR P1 |
| 11031075 | 10-Mar-2011 | 02:46:48 | 02:48:14 | 02:48:52 | 124 | 20 | 12360 | 6-12 | 227 | 221 | 318 | 6.23 | 91.00 | A0 DF DR P1 |
| 11031076 | 10-Mar-2011 | 03:24:56 | 03:25:06 | 03:26:56 | 120 | 0 | 71 | 6-12 | 210 | 251 | 327 | 8.04 | 89.67 | A0 DF P1 |
| Date | Start | Peak | End | Classification | B [deg] | LCM [deg] |
|---|---|---|---|---|---|---|
| No data |

