move the mouse pointer over that image.
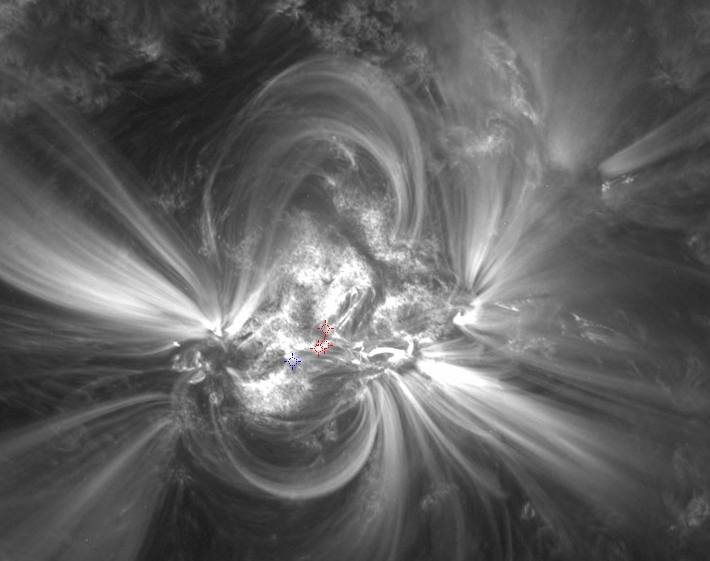
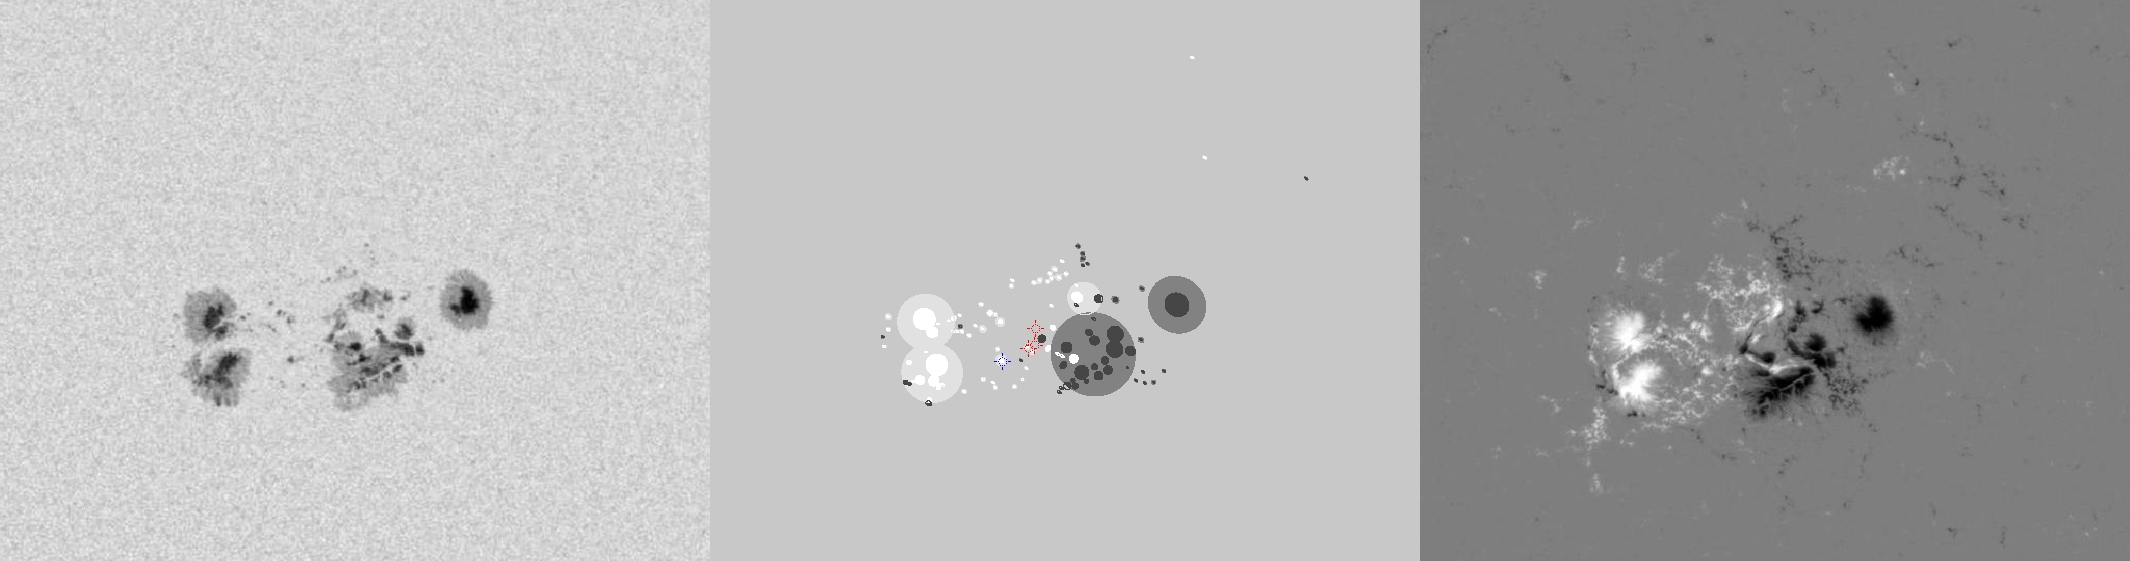
| Evolution of sunspot group NOAA 11166 and positions of flares in it animated by using the data of SDO/HMI Debrecen Data (HMIDD) sunspot catalogue (lower panel, middle, ellipses with positions and areas corresponding to the relevant data of spots in SDO and with grey-scale colour coding of the magnetic polarities corresponding to that of the magnetograms), SDO/HMI continuum images (lower panel, left) and magnetograms (lower panel, right), SDO/AIA images (upper panel, middle), GOES and RHESSI flare data (red and blue symbols) observed within the interval around the time of HMIDD data. |
|
When you want to zoom in on one of the images, simply move the mouse pointer over that image. |
 |
| Year | Month | Day | Hour | Min | Sec | NOAA | Proj.U | Proj.WS | Corr.U | Corr.WS | B | L | LCM | Pos.angle | r | MU | MP |
|---|---|---|---|---|---|---|---|---|---|---|---|---|---|---|---|---|---|
| 2011 | 03 | 09 | 22 | 58 | 60 | 11166 | 417 | 2057 | 222 | 1084 | 8.93 | 90.94 | 10.51 | 327.86 | 0.3347 | -137.5 | -14.5 |
| Flare | Date | Start | Peak | End | Dur [s] | Peak [c/s] | Total Counts | Energy [keV] | X pos [asec] | Y pos [asec] | Radial [asec] | B [deg] | L [deg] | Flags |
|---|---|---|---|---|---|---|---|---|---|---|---|---|---|---|
| 11030962 | 9-Mar-2011 | 22:37:08 | 22:37:18 | 22:40:16 | 188 | 1 | 785 | 6-12 | 176 | 262 | 315 | 8.67 | 90.24 | A0 DF P1 |
| 11030963 | 9-Mar-2011 | 22:40:16 | 22:56:02 | 23:10:28 | 1812 | 13 | 54551 | 6-12 | 178 | 260 | 316 | 8.55 | 90.18 | A0 DF DR P1 |
| 11030991 | 9-Mar-2011 | 23:10:28 | 23:22:18 | 23:38:08 | 1660 | 4938 | 8326916 | 50-100 | 190 | 272 | 332 | 9.31 | 90.70 | a0 a1 A3 DF DR EE P1 |
| Date | Start | Peak | End | Classification | B [deg] | LCM [deg] |
|---|---|---|---|---|---|---|
| 9-Mar-2011 | 23:13 | 23:23 | 23:29 | X1.5 | 08 | 09 |

