move the mouse pointer over that image.
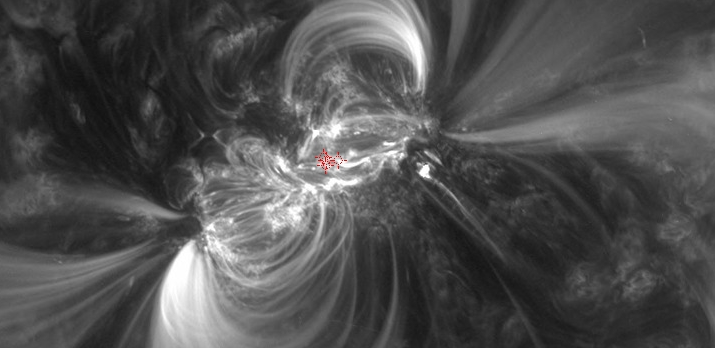
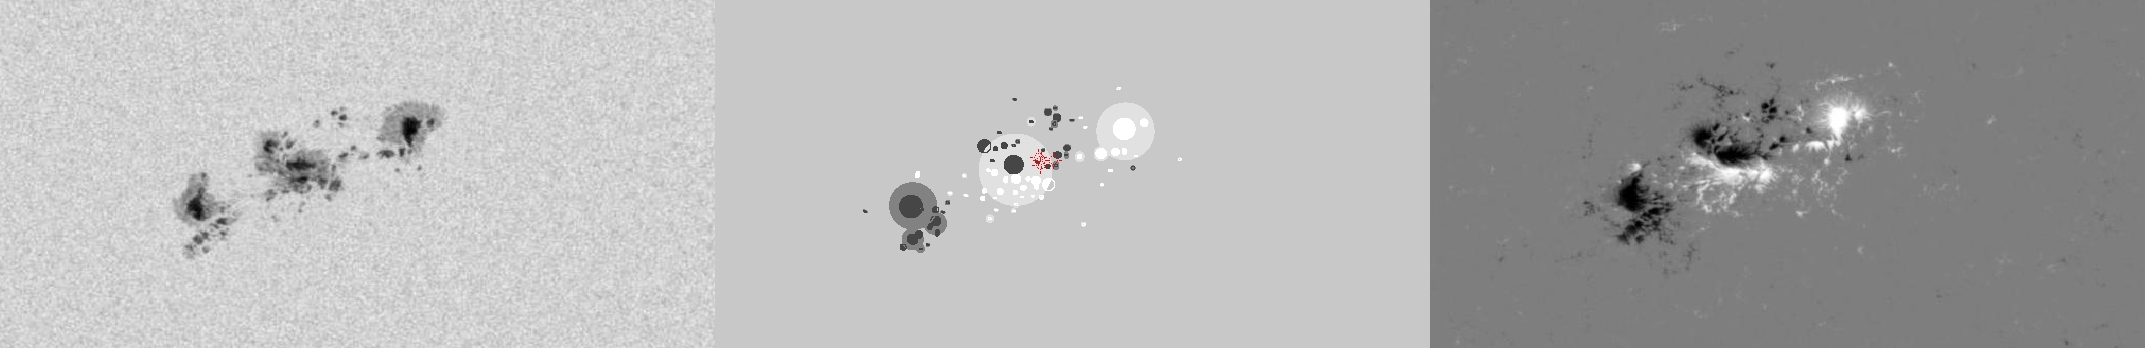
| Evolution of sunspot group NOAA 11158 and positions of flares in it animated by using the data of SDO/HMI Debrecen Data (HMIDD) sunspot catalogue (lower panel, middle, ellipses with positions and areas corresponding to the relevant data of spots in SDO and with grey-scale colour coding of the magnetic polarities corresponding to that of the magnetograms), SDO/HMI continuum images (lower panel, left) and magnetograms (lower panel, right), SDO/AIA images (upper panel, middle), GOES and RHESSI flare data (red and blue symbols) observed within the interval around the time of HMIDD data. |
|
When you want to zoom in on one of the images, simply move the mouse pointer over that image. |
 |
| Year | Month | Day | Hour | Min | Sec | NOAA | Proj.U | Proj.WS | Corr.U | Corr.WS | B | L | LCM | Pos.angle | r | MU | MP |
|---|---|---|---|---|---|---|---|---|---|---|---|---|---|---|---|---|---|
| 2011 | 02 | 13 | 22 | 58 | 57 | 11158 | 325 | 1346 | 167 | 687 | -20.15 | 35.06 | -1.48 | 175.23 | 0.2389 | -166.2 | 1.5 |
| Flare | Date | Start | Peak | End | Dur [s] | Peak [c/s] | Total Counts | Energy [keV] | X pos [asec] | Y pos [asec] | Radial [asec] | B [deg] | L [deg] | Flags |
|---|---|---|---|---|---|---|---|---|---|---|---|---|---|---|
| 11021368 | 13-Feb-2011 | 22:27:56 | 22:31:06 | 22:32:08 | 252 | 46 | 56496 | 6-12 | -4 | -217 | 217 | -19.73 | 35.50 | A0 |
| 11021392 | 13-Feb-2011 | 22:32:08 | 22:34:46 | 22:41:44 | 576 | 100 | 238992 | 6-12 | 6 | -219 | 219 | -19.86 | 36.10 | A0 DR P1 |
| 11021369 | 13-Feb-2011 | 22:41:44 | 22:44:10 | 22:46:40 | 296 | 76 | 103536 | 6-12 | 1 | -222 | 222 | -20.04 | 35.69 | A0 DR P1 |
| 11021370 | 13-Feb-2011 | 22:46:40 | 22:57:22 | 23:07:08 | 1228 | 168 | 808128 | 6-12 | 5 | -219 | 219 | -19.86 | 35.83 | A0 DR P1 Q2 |
| Date | Start | Peak | End | Classification | B [deg] | LCM [deg] |
|---|---|---|---|---|---|---|
| No data |

