move the mouse pointer over that image.
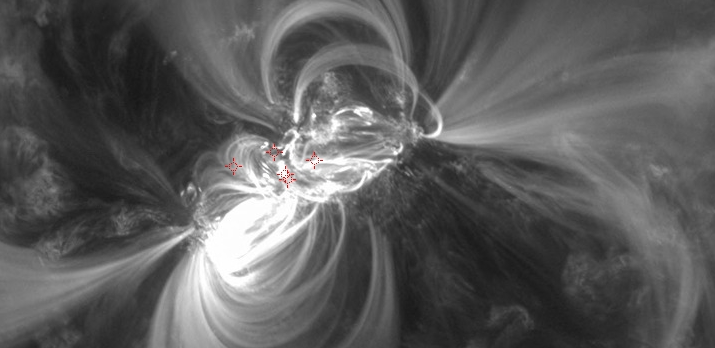
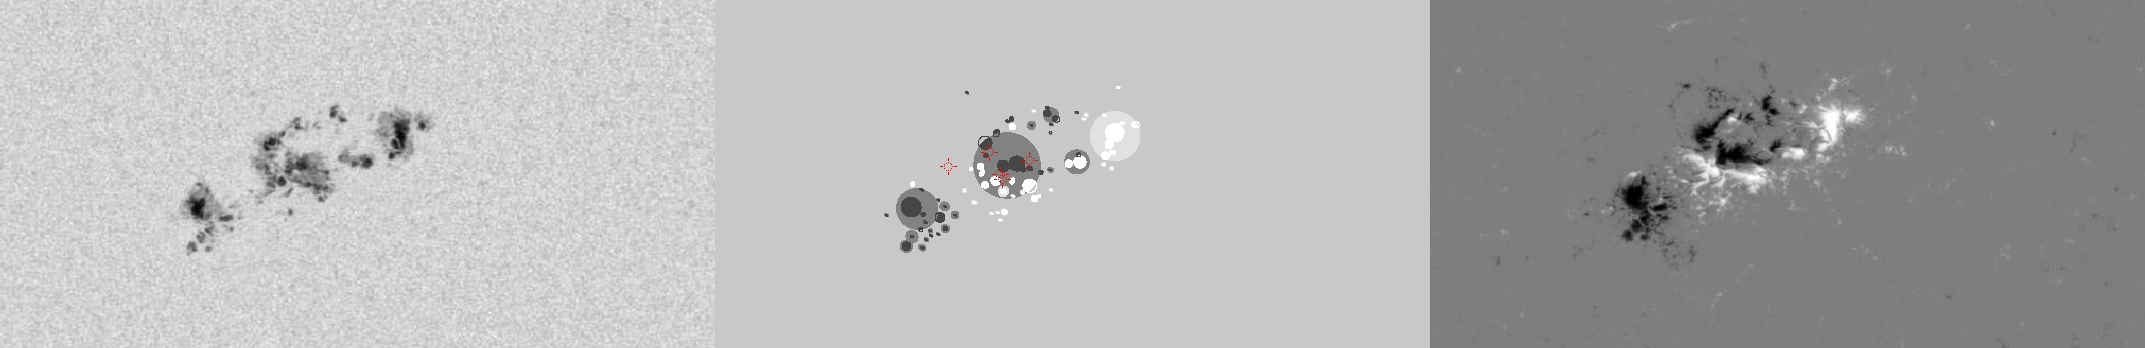
| Evolution of sunspot group NOAA 11158 and positions of flares in it animated by using the data of SDO/HMI Debrecen Data (HMIDD) sunspot catalogue (lower panel, middle, ellipses with positions and areas corresponding to the relevant data of spots in SDO and with grey-scale colour coding of the magnetic polarities corresponding to that of the magnetograms), SDO/HMI continuum images (lower panel, left) and magnetograms (lower panel, right), SDO/AIA images (upper panel, middle), GOES and RHESSI flare data (red and blue symbols) observed within the interval around the time of HMIDD data. |
|
When you want to zoom in on one of the images, simply move the mouse pointer over that image. |
 |
| Year | Month | Day | Hour | Min | Sec | NOAA | Proj.U | Proj.WS | Corr.U | Corr.WS | B | L | LCM | Pos.angle | r | MU | MP |
|---|---|---|---|---|---|---|---|---|---|---|---|---|---|---|---|---|---|
| 2011 | 02 | 13 | 15 | 58 | 57 | 11158 | 300 | 1097 | 159 | 568 | -20.10 | 35.04 | -5.36 | 160.34 | 0.2514 | -110.5 | -43.5 |
| Flare | Date | Start | Peak | End | Dur [s] | Peak [c/s] | Total Counts | Energy [keV] | X pos [asec] | Y pos [asec] | Radial [asec] | B [deg] | L [deg] | Flags |
|---|---|---|---|---|---|---|---|---|---|---|---|---|---|---|
| 11021350 | 13-Feb-2011 | 15:55:12 | 15:59:02 | 16:04:32 | 560 | 113 | 138512 | 6-12 | -111 | -223 | 249 | -20.04 | 32.29 | A0 DF DR P1 |
| 11021389 | 13-Feb-2011 | 16:04:32 | 16:05:50 | 16:07:24 | 172 | 30 | 26592 | 6-12 | -75 | -231 | 243 | -20.56 | 34.50 | A0 DR P1 |
| 11021351 | 13-Feb-2011 | 16:07:24 | 16:10:58 | 16:12:48 | 324 | 64 | 70752 | 6-12 | -75 | -228 | 240 | -20.37 | 34.46 | A0 DR P1 |
| 11021352 | 13-Feb-2011 | 16:12:48 | 16:17:30 | 16:21:48 | 540 | 192 | 229536 | 6-12 | -80 | -214 | 229 | -19.51 | 34.11 | A0 DR P1 |
| 11021354 | 13-Feb-2011 | 16:21:48 | 16:23:26 | 16:28:00 | 372 | 88 | 92688 | 6-12 | -53 | -219 | 225 | -19.83 | 35.76 | A0 DR P1 |
| Date | Start | Peak | End | Classification | B [deg] | LCM [deg] |
|---|---|---|---|---|---|---|
| No data |

