move the mouse pointer over that image.
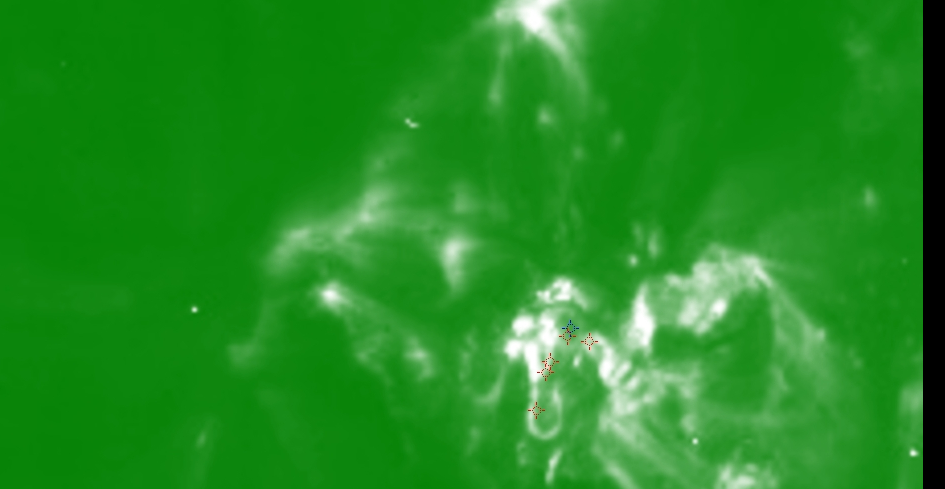
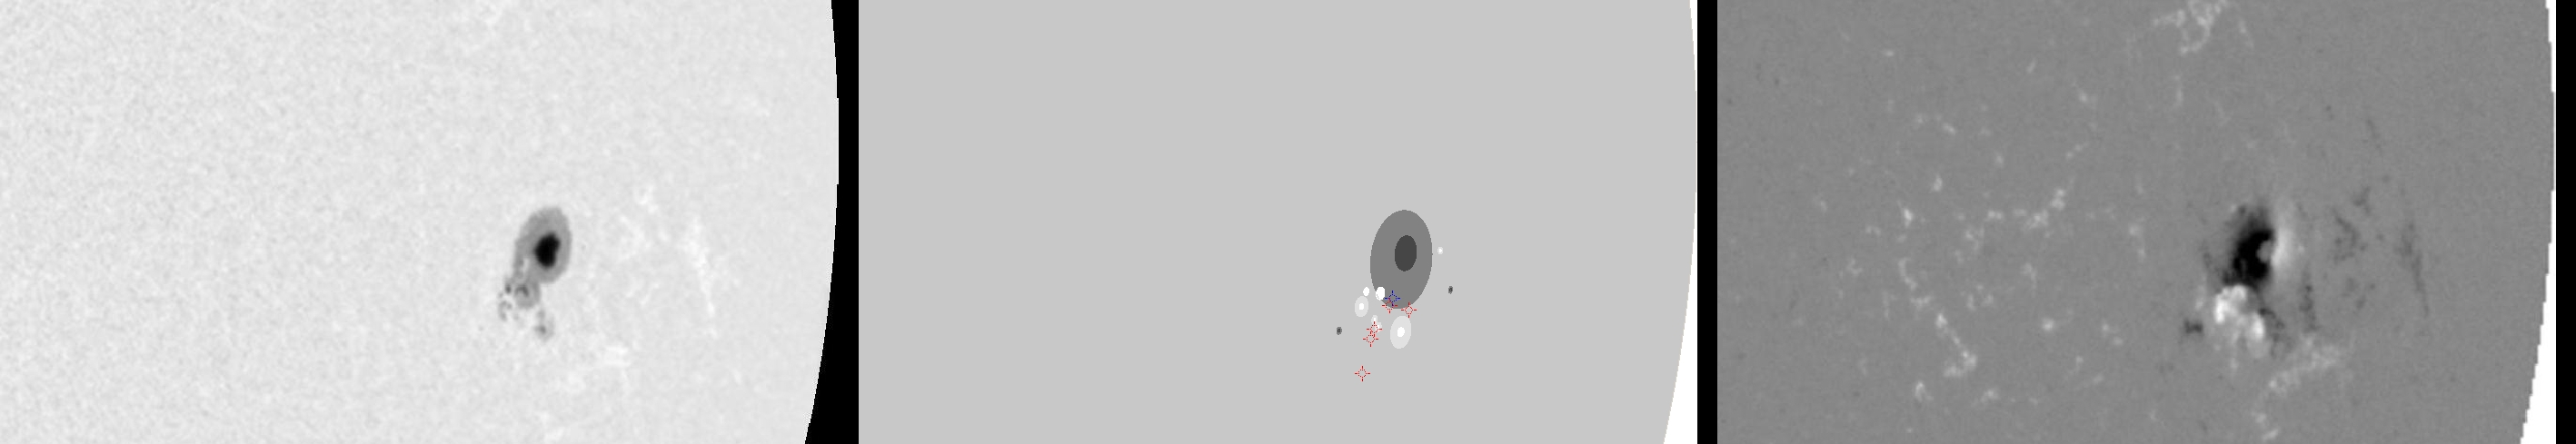
| Evolution of sunspot group NOAA 10930 and positions of flares in it animated by using the data of SOHO/MDI Debrecen Data (SDD) sunspot catalogue (lower panel, middle, ellipses with positions and areas corresponding to the relevant data of spots in SDD and with grey-scale colour coding of the magnetic polarities corresponding to that of the magnetograms), SOHO/MDI continuum images (lower panel, left) and magnetograms (lower panel, right), SOHO/EIT images (upper panel, middle), GOES and RHESSI flare data (red and blue symbols) observed within the interval around the time of SDD data. |
|
When you want to zoom in on one of the images, simply move the mouse pointer over that image. |
 |
| Year | Month | Day | Hour | Min | Sec | NOAA | Proj.U | Proj.WS | Corr.U | Corr.WS | B | L | LCM | Pos.angle | r | MU | MP |
|---|---|---|---|---|---|---|---|---|---|---|---|---|---|---|---|---|---|
| 2006 | 12 | 15 | 09 | 54 | 31 | 10930 | 123 | 907 | 99 | 734 | -5.67 | 9.19 | 52.09 | 263.50 | 0.7926 | -507.0 | -371.3 |
| Flare | Date | Start | Peak | End | Dur [s] | Peak [c/s] | Total Counts | Energy [keV] | X pos [asec] | Y pos [asec] | Radial [asec] | B [deg] | L [deg] | Flags |
|---|---|---|---|---|---|---|---|---|---|---|---|---|---|---|
| 6121533 | 15-Dec-2006 | 07:38:44 | 07:39:14 | 07:40:36 | 112 | 42 | 21408 | 6-12 | 747 | -117 | 756 | -7.48 | 369.05 | A0 |
| 6121506 | 15-Dec-2006 | 07:50:24 | 07:59:42 | 08:14:08 | 1424 | 1008 | 4291992 | 12-25 | 737 | -114 | 746 | -7.31 | 367.88 | A0 DR P1 PE |
| 6121534 | 15-Dec-2006 | 08:48:40 | 08:49:14 | 08:56:00 | 440 | 480 | 893904 | 6-12 | 736 | -130 | 748 | -8.28 | 367.49 | A0 DR ES P1 |
| 6121541 | 15-Dec-2006 | 08:56:00 | 09:03:10 | 09:27:04 | 1864 | 480 | 2955648 | 6-12 | 736 | -137 | 749 | -8.70 | 367.44 | A0 DR P1 |
| 6121507 | 15-Dec-2006 | 09:35:44 | 09:38:50 | 09:43:08 | 444 | 104 | 199968 | 6-12 | 737 | -161 | 754 | -10.14 | 367.51 | A0 DR P1 PE |
| Date | Start | Peak | End | Classification | B [deg] | LCM [deg] |
|---|---|---|---|---|---|---|
| 15-Dec-2006 | 07:53 | 08:06 | 08:27 | B7.0 | -07 | 51 |

