move the mouse pointer over that image.
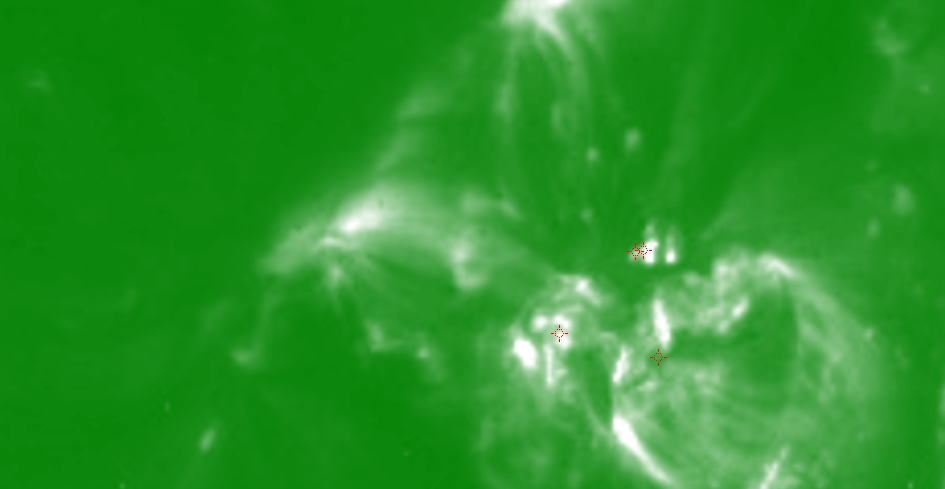
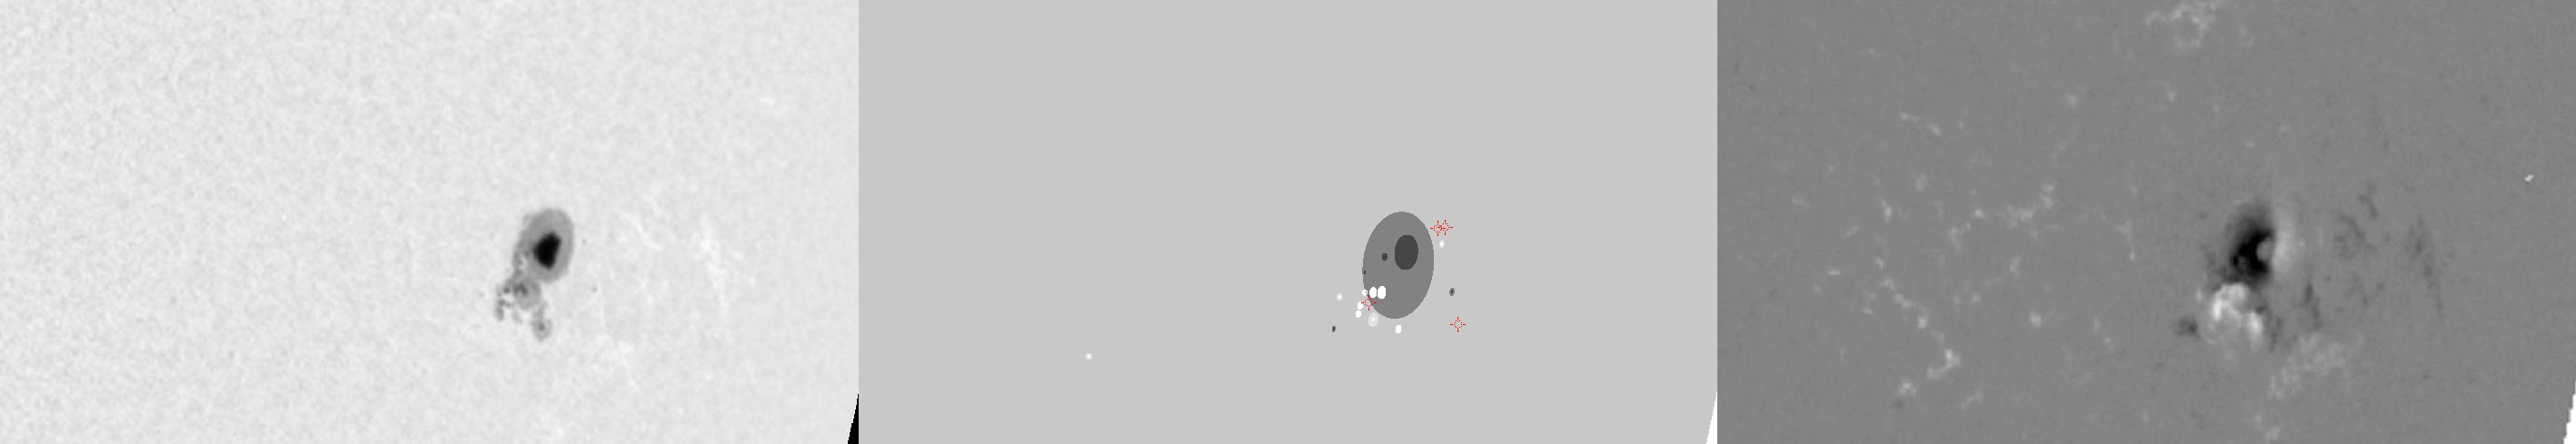
| Evolution of sunspot group NOAA 10930 and positions of flares in it animated by using the data of SOHO/MDI Debrecen Data (SDD) sunspot catalogue (lower panel, middle, ellipses with positions and areas corresponding to the relevant data of spots in SDD and with grey-scale colour coding of the magnetic polarities corresponding to that of the magnetograms), SOHO/MDI continuum images (lower panel, left) and magnetograms (lower panel, right), SOHO/EIT images (upper panel, middle), GOES and RHESSI flare data (red and blue symbols) observed within the interval around the time of SDD data. |
|
When you want to zoom in on one of the images, simply move the mouse pointer over that image. |
 |
| Year | Month | Day | Hour | Min | Sec | NOAA | Proj.U | Proj.WS | Corr.U | Corr.WS | B | L | LCM | Pos.angle | r | MU | MP |
|---|---|---|---|---|---|---|---|---|---|---|---|---|---|---|---|---|---|
| 2006 | 12 | 15 | 04 | 47 | 31 | 10930 | 141 | 995 | 107 | 755 | -5.58 | 9.03 | 49.12 | 263.34 | 0.7599 | -440.2 | -332.4 |
| Flare | Date | Start | Peak | End | Dur [s] | Peak [c/s] | Total Counts | Energy [keV] | X pos [asec] | Y pos [asec] | Radial [asec] | B [deg] | L [deg] | Flags |
|---|---|---|---|---|---|---|---|---|---|---|---|---|---|---|
| 6121528 | 15-Dec-2006 | 04:01:32 | 04:09:02 | 04:15:48 | 856 | 34 | 121536 | 6-12 | 708 | -112 | 717 | -7.21 | 367.29 | A0 |
| 6121529 | 15-Dec-2006 | 04:28:16 | 04:29:02 | 04:30:36 | 140 | 30 | 18528 | 6-12 | 759 | -61 | 761 | -4.11 | 371.52 | A0 |
| 6121530 | 15-Dec-2006 | 04:30:36 | 04:35:18 | 04:40:08 | 572 | 232 | 225072 | 6-12 | 765 | -60 | 767 | -4.05 | 372.05 | A0 |
| 6121531 | 15-Dec-2006 | 04:57:36 | 04:58:34 | 05:02:16 | 280 | 42 | 54576 | 6-12 | 778 | -127 | 788 | -8.04 | 373.75 | A0 P1 PE |
| Date | Start | Peak | End | Classification | B [deg] | LCM [deg] |
|---|---|---|---|---|---|---|
| No data |

