move the mouse pointer over that image.
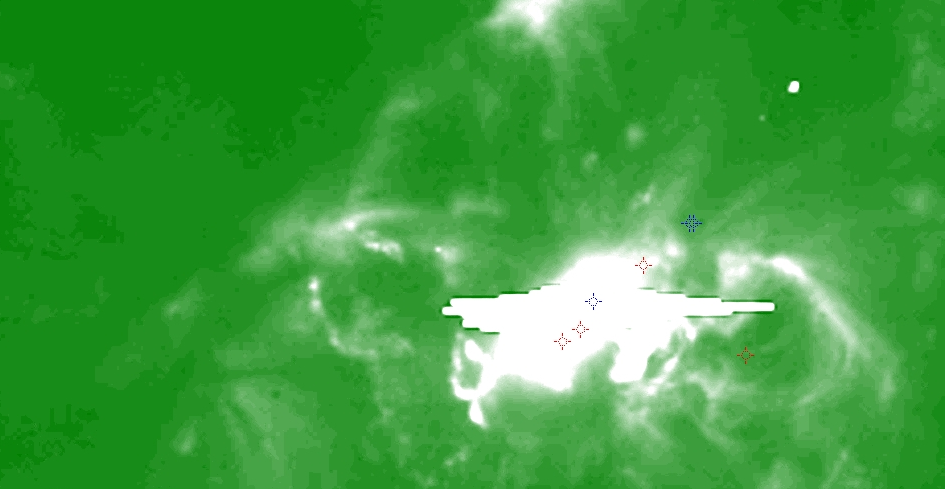
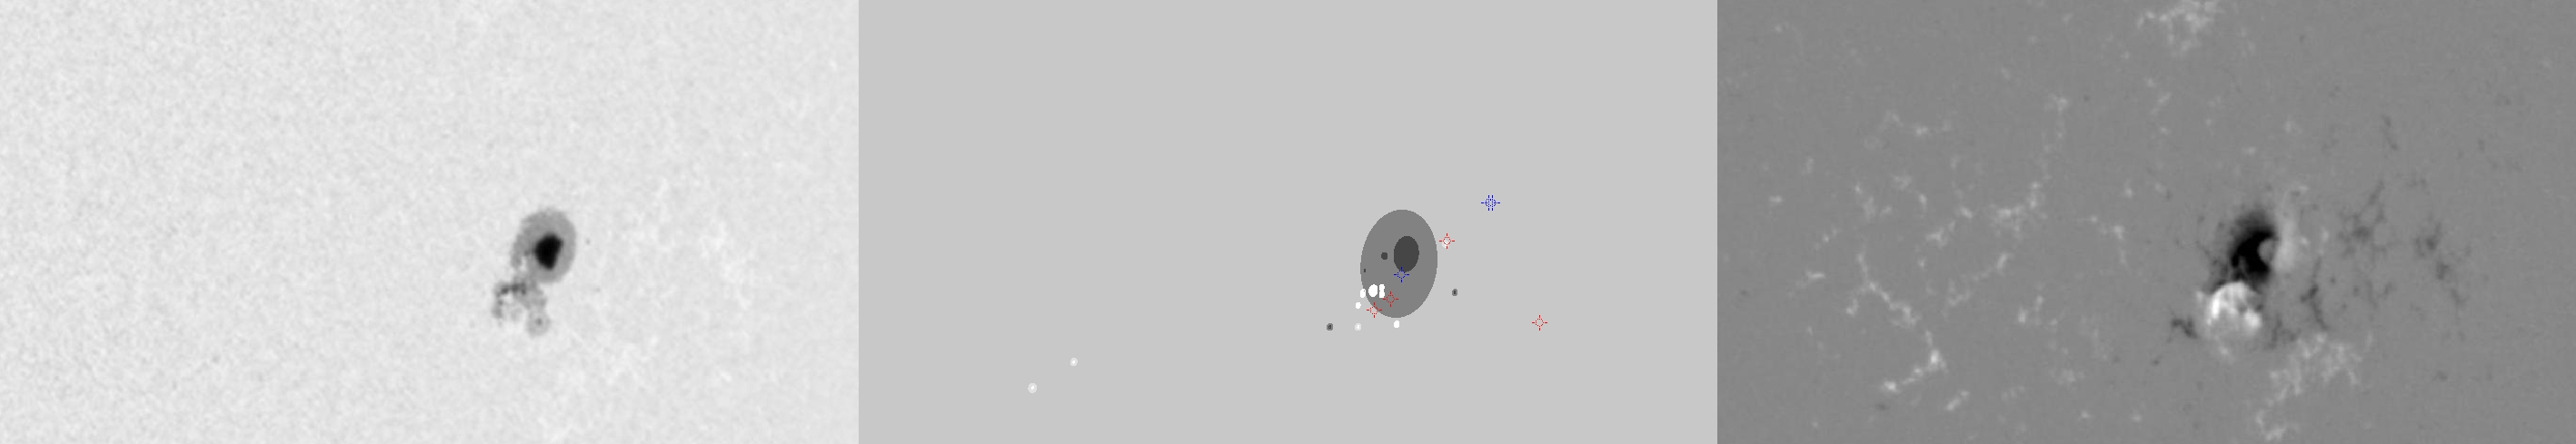
| Evolution of sunspot group NOAA 10930 and positions of flares in it animated by using the data of SOHO/MDI Debrecen Data (SDD) sunspot catalogue (lower panel, middle, ellipses with positions and areas corresponding to the relevant data of spots in SDD and with grey-scale colour coding of the magnetic polarities corresponding to that of the magnetograms), SOHO/MDI continuum images (lower panel, left) and magnetograms (lower panel, right), SOHO/EIT images (upper panel, middle), GOES and RHESSI flare data (red and blue symbols) observed within the interval around the time of SDD data. |
|
When you want to zoom in on one of the images, simply move the mouse pointer over that image. |
 |
| Year | Month | Day | Hour | Min | Sec | NOAA | Proj.U | Proj.WS | Corr.U | Corr.WS | B | L | LCM | Pos.angle | r | MU | MP |
|---|---|---|---|---|---|---|---|---|---|---|---|---|---|---|---|---|---|
| 2006 | 12 | 14 | 22 | 37 | 31 | 10930 | 147 | 1083 | 105 | 768 | -5.52 | 8.91 | 45.62 | 263.02 | 0.7188 | -564.6 | -310.1 |
| Flare | Date | Start | Peak | End | Dur [s] | Peak [c/s] | Total Counts | Energy [keV] | X pos [asec] | Y pos [asec] | Radial [asec] | B [deg] | L [deg] | Flags |
|---|---|---|---|---|---|---|---|---|---|---|---|---|---|---|
| 6121454 | 14-Dec-2006 | 20:16:40 | 20:20:46 | 20:24:20 | 460 | 40 | 64272 | 6-12 | 770 | -125 | 780 | -7.90 | 377.63 | A0 DR P1 |
| 6121455 | 14-Dec-2006 | 21:38:12 | 21:41:06 | 21:43:16 | 304 | 1 | 1525 | 6-12 | 681 | -109 | 689 | -7.03 | 368.45 | A0 |
| 6121465 | 14-Dec-2006 | 21:43:16 | 21:47:34 | 21:48:24 | 308 | 1 | 1713 | 6-12 | 671 | -117 | 681 | -7.51 | 367.60 | A0 GD P1 |
| 6121466 | 14-Dec-2006 | 23:30:00 | 23:33:02 | 23:35:28 | 328 | 104 | 174608 | 12-25 | 742 | -69 | 745 | -4.59 | 372.64 | a0 A1 |
| Date | Start | Peak | End | Classification | B [deg] | LCM [deg] |
|---|---|---|---|---|---|---|
| 14-Dec-2006 | 19:31 | 19:35 | 19:39 | B3.1 | -03 | 50 |
| 14-Dec-2006 | 19:49 | 19:59 | 20:04 | B7.0 | -03 | 50 |
| 14-Dec-2006 | 21:07 | 22:15 | 22:26 | X1.5 | -06 | 46 |

