move the mouse pointer over that image.
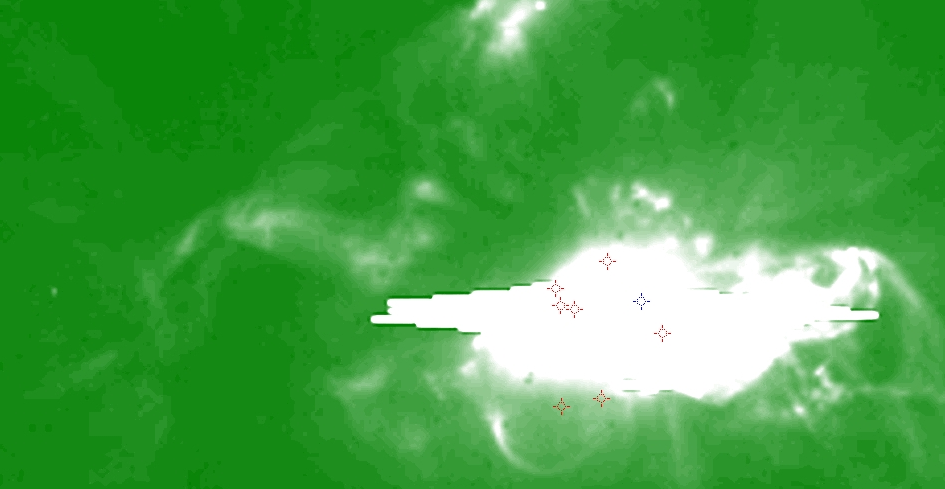
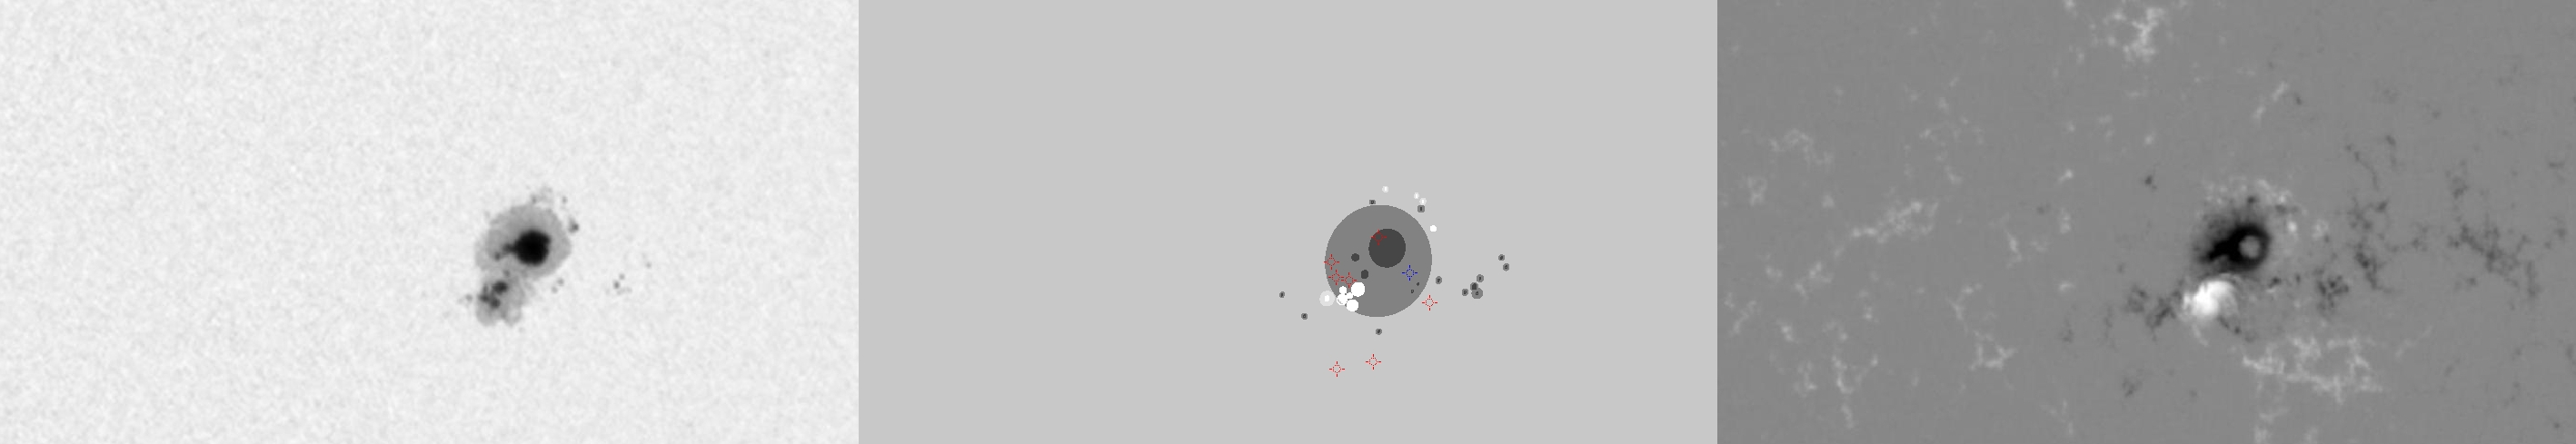
| Evolution of sunspot group NOAA 10930 and positions of flares in it animated by using the data of SOHO/MDI Debrecen Data (SDD) sunspot catalogue (lower panel, middle, ellipses with positions and areas corresponding to the relevant data of spots in SDD and with grey-scale colour coding of the magnetic polarities corresponding to that of the magnetograms), SOHO/MDI continuum images (lower panel, left) and magnetograms (lower panel, right), SOHO/EIT images (upper panel, middle), GOES and RHESSI flare data (red and blue symbols) observed within the interval around the time of SDD data. |
|
When you want to zoom in on one of the images, simply move the mouse pointer over that image. |
 |
| Year | Month | Day | Hour | Min | Sec | NOAA | Proj.U | Proj.WS | Corr.U | Corr.WS | B | L | LCM | Pos.angle | r | MU | MP |
|---|---|---|---|---|---|---|---|---|---|---|---|---|---|---|---|---|---|
| 2006 | 12 | 12 | 23 | 59 | 31 | 10930 | 259 | 1638 | 138 | 868 | -5.45 | 9.07 | 20.16 | 255.93 | 0.3555 | -676.8 | -351.8 |
| Flare | Date | Start | Peak | End | Dur [s] | Peak [c/s] | Total Counts | Energy [keV] | X pos [asec] | Y pos [asec] | Radial [asec] | B [deg] | L [deg] | Flags |
|---|---|---|---|---|---|---|---|---|---|---|---|---|---|---|
| 6121291 | 12-Dec-2006 | 23:18:44 | 23:38:38 | 23:41:28 | 1364 | 880 | 5275296 | 6-12 | 338 | -68 | 345 | -4.51 | 368.84 | A0 GD P1 |
| 6121273 | 12-Dec-2006 | 23:41:28 | 23:55:14 | 00:10:08 | 1720 | 1712 | 11558016 | 12-25 | 314 | -159 | 352 | -9.97 | 367.41 | A0 GE P1 PE |
| 6121362 | 13-Dec-2006 | 01:18:08 | 01:21:14 | 01:33:28 | 920 | 184 | 709056 | 6-12 | 363 | -154 | 394 | -9.67 | 369.77 | A0 |
| 6121338 | 13-Dec-2006 | 01:33:28 | 01:43:06 | 01:46:36 | 788 | 448 | 568224 | 12-25 | 353 | -98 | 367 | -6.31 | 368.73 | A0 P1 PE |
| 6121302 | 13-Dec-2006 | 01:46:36 | 01:49:54 | 01:51:20 | 284 | 944 | 350304 | 6-12 | 346 | -96 | 359 | -6.19 | 368.21 | A0 GE P1 PE |
| 6121305 | 13-Dec-2006 | 02:28:12 | 02:38:58 | 03:31:04 | 3772 | 28208 | 248619072 | 100-300 | 357 | -85 | 367 | -5.54 | 368.44 | a0 a1 A3 DF DR EE ES P1 PE |
| 6121306 | 13-Dec-2006 | 04:04:08 | 04:05:18 | 05:06:40 | 3752 | 752 | 4424582 | 6-12 | 446 | -113 | 460 | -7.20 | 373.62 | a0 A1 DF DR ES P1 |
| Date | Start | Peak | End | Classification | B [deg] | LCM [deg] |
|---|---|---|---|---|---|---|
| 13-Dec-2006 | 02:14 | 02:40 | 02:57 | X3.4 | -06 | 23 |

