
move the mouse pointer over that image.
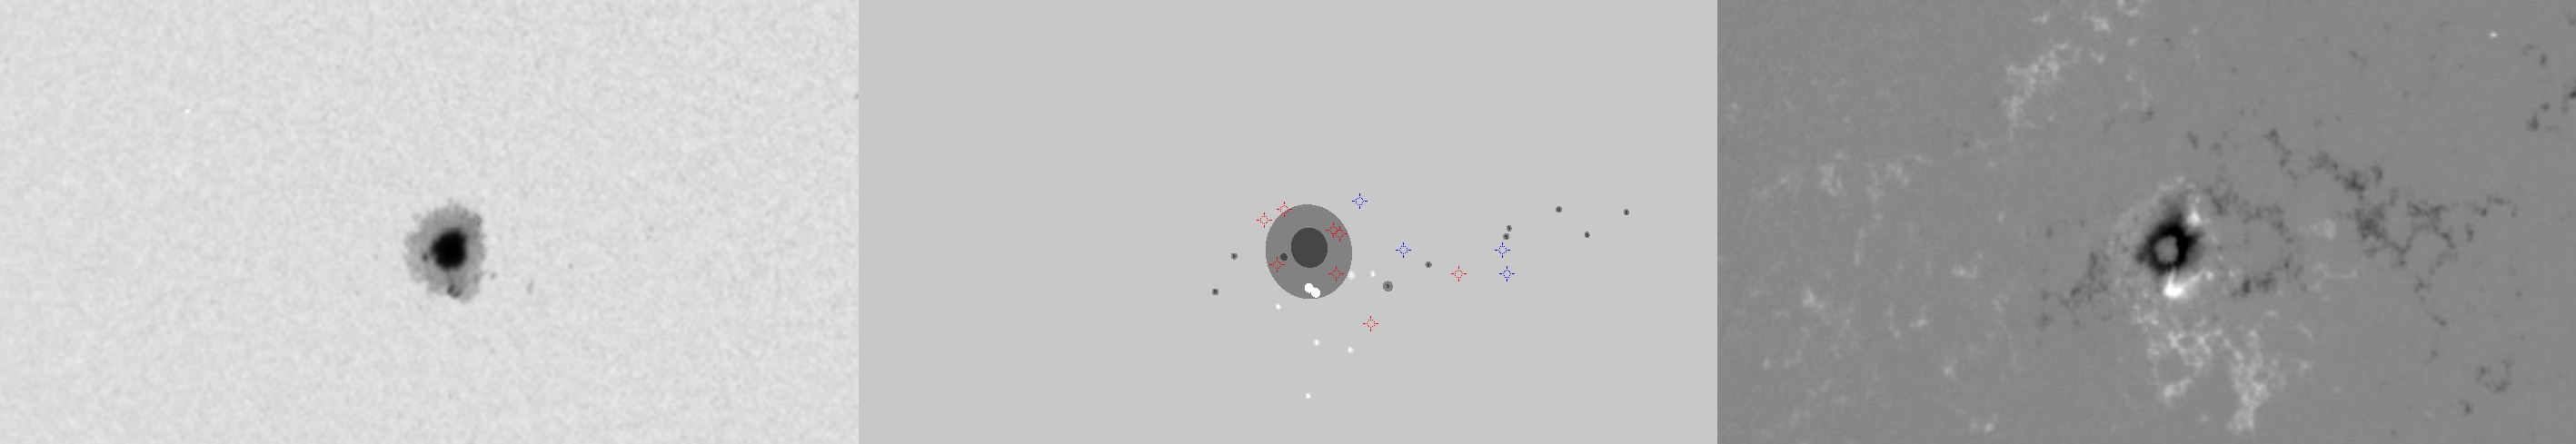
| Evolution of sunspot group NOAA 10930 and positions of flares in it animated by using the data of SOHO/MDI Debrecen Data (SDD) sunspot catalogue (lower panel, middle, ellipses with positions and areas corresponding to the relevant data of spots in SDD and with grey-scale colour coding of the magnetic polarities corresponding to that of the magnetograms), SOHO/MDI continuum images (lower panel, left) and magnetograms (lower panel, right), SOHO/EIT images (upper panel, middle), GOES and RHESSI flare data (red and blue symbols) observed within the interval around the time of SDD data. |
|
When you want to zoom in on one of the images, simply move the mouse pointer over that image. |
 |
| Year | Month | Day | Hour | Min | Sec | NOAA | Proj.U | Proj.WS | Corr.U | Corr.WS | B | L | LCM | Pos.angle | r | MU | MP |
|---|---|---|---|---|---|---|---|---|---|---|---|---|---|---|---|---|---|
| 2006 | 12 | 09 | 12 | 47 | 31 | 10930 | 202 | 1097 | 112 | 605 | -5.14 | 9.35 | -25.27 | 101.65 | 0.4358 | -918.1 | -268.3 |
| Flare | Date | Start | Peak | End | Dur [s] | Peak [c/s] | Total Counts | Energy [keV] | X pos [asec] | Y pos [asec] | Radial [asec] | B [deg] | L [deg] | Flags |
|---|---|---|---|---|---|---|---|---|---|---|---|---|---|---|
| 6120929 | 9-Dec-2006 | 09:21:40 | 09:22:06 | 09:22:36 | 56 | 44 | 6048 | 6-12 | -436 | -72 | 442 | -4.32 | 8.59 | A0 |
| 6120919 | 9-Dec-2006 | 09:55:00 | 09:55:34 | 09:56:28 | 88 | 52 | 16512 | 6-12 | -431 | -70 | 437 | -4.20 | 8.62 | A0 DR P1 |
| 6120903 | 9-Dec-2006 | 10:31:52 | 10:41:22 | 10:46:56 | 904 | 336 | 954720 | 12-25 | -393 | -134 | 416 | -8.04 | 10.53 | A0 DR P1 |
| 6120930 | 9-Dec-2006 | 10:46:56 | 10:55:50 | 11:24:04 | 2228 | 2160 | 6384192 | 12-25 | -329 | -100 | 344 | -6.00 | 14.65 | A0 DR P1 |
| 6120904 | 9-Dec-2006 | 11:29:56 | 11:30:46 | 11:32:16 | 140 | 60 | 31824 | 6-12 | -403 | -100 | 415 | -6.00 | 9.53 | A0 DR P1 |
| 6120931 | 9-Dec-2006 | 14:20:36 | 14:21:42 | 14:24:28 | 232 | 22 | 23856 | 6-12 | -392 | -55 | 396 | -3.33 | 8.79 | A0 |
| 6120923 | 9-Dec-2006 | 17:04:44 | 17:08:14 | 17:12:04 | 440 | 112 | 117648 | 6-12 | -351 | -93 | 363 | -5.61 | 9.85 | A0 DR P1 PE |
| 6120914 | 9-Dec-2006 | 17:12:04 | 17:18:34 | 17:24:40 | 756 | 108 | 179376 | 6-12 | -357 | -62 | 362 | -3.76 | 9.43 | A0 DR P1 PE |
| Date | Start | Peak | End | Classification | B [deg] | LCM [deg] |
|---|---|---|---|---|---|---|
| 9-Dec-2006 | 10:29 | 10:41 | 10:46 | B4.5 | -06 | -18 |
| 9-Dec-2006 | 10:48 | 10:59 | 11:05 | C1.3 | -05 | -18 |
| 9-Dec-2006 | 15:01 | 15:07 | 15:11 | B1.8 | -03 | -22 |
| 9-Dec-2006 | 17:03 | 17:08 | 17:10 | B1.6 | -05 | -19 |

