
move the mouse pointer over that image.
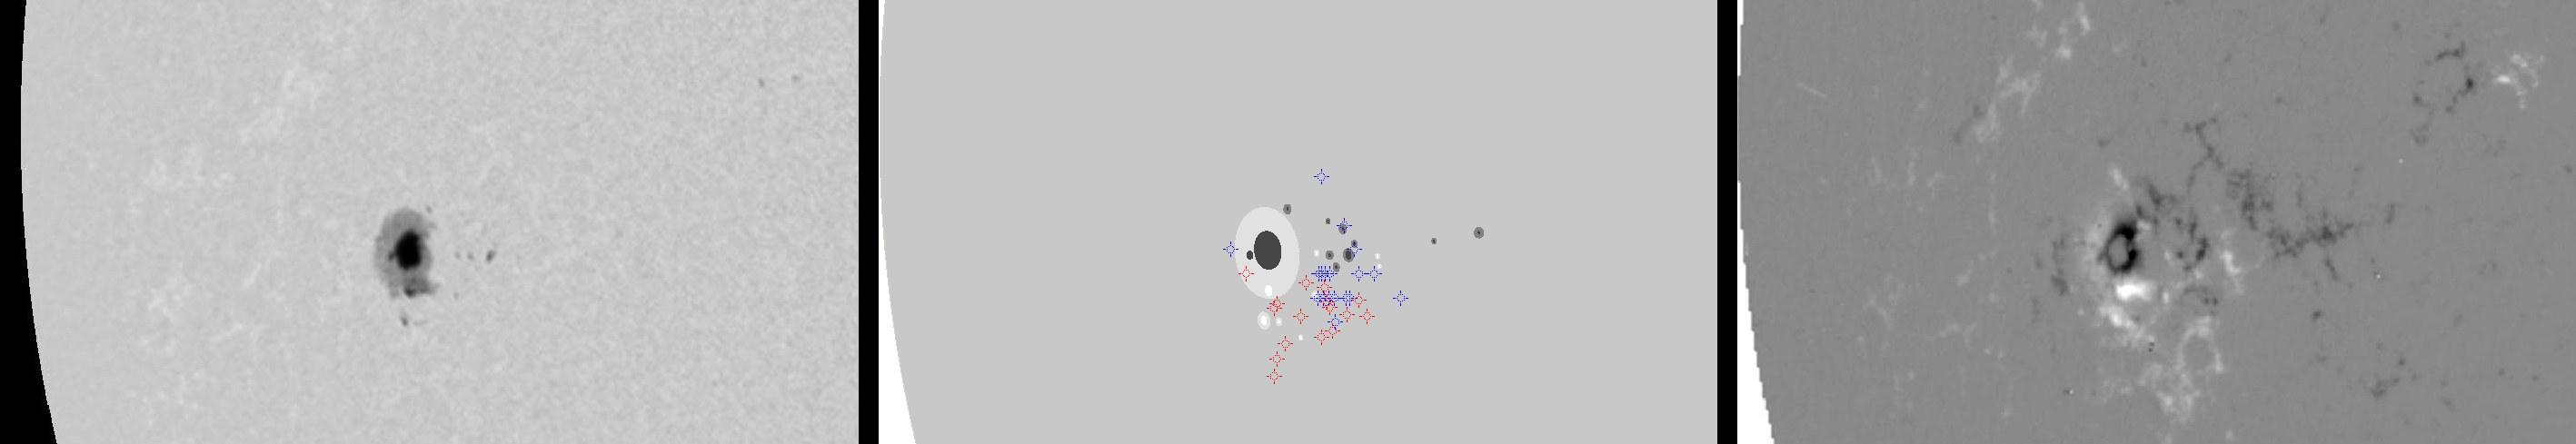
| Evolution of sunspot group NOAA 10930 and positions of flares in it animated by using the data of SOHO/MDI Debrecen Data (SDD) sunspot catalogue (lower panel, middle, ellipses with positions and areas corresponding to the relevant data of spots in SDD and with grey-scale colour coding of the magnetic polarities corresponding to that of the magnetograms), SOHO/MDI continuum images (lower panel, left) and magnetograms (lower panel, right), SOHO/EIT images (upper panel, middle), GOES and RHESSI flare data (red and blue symbols) observed within the interval around the time of SDD data. |
|
When you want to zoom in on one of the images, simply move the mouse pointer over that image. |
 |
| Year | Month | Day | Hour | Min | Sec | NOAA | Proj.U | Proj.WS | Corr.U | Corr.WS | B | L | LCM | Pos.angle | r | MU | MP |
|---|---|---|---|---|---|---|---|---|---|---|---|---|---|---|---|---|---|
| 2006 | 12 | 07 | 23 | 08 | 31 | 10930 | 153 | 865 | 111 | 615 | -5.24 | 9.50 | -45.81 | 97.35 | 0.7221 | -473.1 | 24.2 |
| Flare | Date | Start | Peak | End | Dur [s] | Peak [c/s] | Total Counts | Energy [keV] | X pos [asec] | Y pos [asec] | Radial [asec] | B [deg] | L [deg] | Flags |
|---|---|---|---|---|---|---|---|---|---|---|---|---|---|---|
| 6120752 | 7-Dec-2006 | 11:26:48 | 11:33:38 | 11:34:48 | 480 | 28 | 30720 | 6-12 | -758 | -132 | 770 | -7.76 | 8.04 | A0 DF DR GD GE P1 |
| 6120743 | 7-Dec-2006 | 12:08:08 | 12:10:26 | 12:23:16 | 908 | 102 | 264075 | 6-12 | -770 | -142 | 783 | -8.37 | 6.37 | A0 DF DR P1 |
| 6120753 | 7-Dec-2006 | 12:23:16 | 12:35:50 | 12:54:32 | 1876 | 192 | 909936 | 6-12 | -758 | -131 | 769 | -7.71 | 7.48 | A0 DF DR P1 |
| 6120744 | 7-Dec-2006 | 12:54:32 | 13:00:58 | 13:09:16 | 884 | 26 | 97896 | 6-12 | -747 | -121 | 757 | -7.10 | 8.43 | A0 DF DR P1 |
| 6120703 | 7-Dec-2006 | 14:46:24 | 14:53:22 | 14:54:12 | 468 | 200 | 121224 | 12-25 | -744 | -122 | 754 | -7.17 | 7.68 | A0 DF DR P1 PE |
| 6120704 | 7-Dec-2006 | 15:20:00 | 15:22:10 | 15:52:40 | 1960 | 203 | 534898 | 6-12 | -737 | -126 | 748 | -7.41 | 8.05 | A0 DF DR GD P1 PE |
| 6120747 | 7-Dec-2006 | 15:52:40 | 15:54:46 | 16:00:20 | 460 | 24 | 33672 | 6-12 | -734 | -112 | 743 | -6.57 | 8.16 | A0 DF DR P1 |
| 6120714 | 7-Dec-2006 | 18:05:00 | 18:05:18 | 18:05:52 | 52 | 24 | 4296 | 6-12 | -720 | -109 | 728 | -6.39 | 8.29 | A0 DF DR GS P1 PE |
| 6120715 | 7-Dec-2006 | 18:33:04 | 19:05:42 | 19:20:00 | 2816 | 1520 | 7864614 | 25-50 | -711 | -132 | 723 | -7.78 | 8.36 | a0 A1 DF DR GE P1 PE |
| 6120710 | 7-Dec-2006 | 20:08:00 | 20:09:02 | 20:56:16 | 2896 | 1234 | 7089147 | 6-12 | -708 | -151 | 724 | -8.92 | 7.86 | A0 DF DR P1 PE |
| 6120754 | 7-Dec-2006 | 20:56:16 | 20:57:38 | 20:57:44 | 88 | 189 | 81593 | 6-12 | -704 | -161 | 722 | -9.53 | 7.67 | A0 DF GE P1 PE |
| 6120748 | 7-Dec-2006 | 21:44:36 | 21:45:46 | 22:20:24 | 2148 | 40 | 369648 | 6-12 | -696 | -173 | 717 | -10.26 | 7.81 | A0 DF DR P1 |
| 6120749 | 7-Dec-2006 | 23:20:28 | 23:22:34 | 23:33:40 | 792 | 40 | 93048 | 6-12 | -674 | -123 | 685 | -7.24 | 9.33 | A0 DF P1 |
| 6120802 | 8-Dec-2006 | 01:05:28 | 01:08:22 | 01:18:48 | 800 | 88 | 188496 | 12-25 | -619 | -146 | 636 | -8.62 | 12.70 | A0 DF P1 |
| 6120803 | 8-Dec-2006 | 01:24:52 | 01:27:18 | 01:36:12 | 680 | 120 | 217344 | 12-25 | -649 | -126 | 661 | -7.43 | 10.26 | A0 DF P1 |
| 6120804 | 8-Dec-2006 | 07:21:20 | 07:23:54 | 07:31:20 | 600 | 192 | 144072 | 12-25 | -588 | -102 | 597 | -6.00 | 11.95 | A0 DF DR P1 |
| Date | Start | Peak | End | Classification | B [deg] | LCM [deg] |
|---|---|---|---|---|---|---|
| 6-Dec-2006 | 15:54 | 15:58 | 16:00 | C1.7 | -06 | -60 |
| 6-Dec-2006 | 16:15 | 16:21 | 16:26 | C4.4 | -07 | -60 |
| 6-Dec-2006 | 18:29 | 18:47 | 19:00 | X6.5 | -05 | -64 |
| 6-Dec-2006 | 20:14 | 20:19 | 20:22 | M3.5 | -06 | -58 |
| 6-Dec-2006 | 21:44 | 21:52 | 21:55 | C7.4 | -06 | -57 |
| 6-Dec-2006 | 22:26 | 22:31 | 22:33 | C3.1 | -07 | -57 |
| 6-Dec-2006 | 23:09 | 23:13 | 23:15 | C1.7 | -07 | -56 |
| 7-Dec-2006 | 00:31 | 00:34 | 00:37 | C1.9 | -08 | -55 |
| 7-Dec-2006 | 02:35 | 02:40 | 02:42 | B5.3 | -04 | -53 |
| 7-Dec-2006 | 03:32 | 03:36 | 03:39 | C2.0 | -05 | -52 |
| 7-Dec-2006 | 04:27 | 04:45 | 05:09 | C6.1 | -07 | -52 |
| 7-Dec-2006 | 08:27 | 08:33 | 08:36 | B4.3 | -02 | -51 |
| 7-Dec-2006 | 10:49 | 11:48 | 12:57 | C1.1 | -07 | -48 |
| 7-Dec-2006 | 14:49 | 15:15 | 15:33 | C1.2 | -07 | -47 |
| 7-Dec-2006 | 18:20 | 19:13 | 19:33 | M2.0 | -06 | -45 |
| 8-Dec-2006 | 01:05 | 01:10 | 01:15 | B4.3 | -07 | -38 |
| 8-Dec-2006 | 01:25 | 01:29 | 01:34 | B3.8 | -06 | -40 |
| 8-Dec-2006 | 07:20 | 07:24 | 07:28 | B4.4 | -06 | -36 |

