move the mouse pointer over that image.
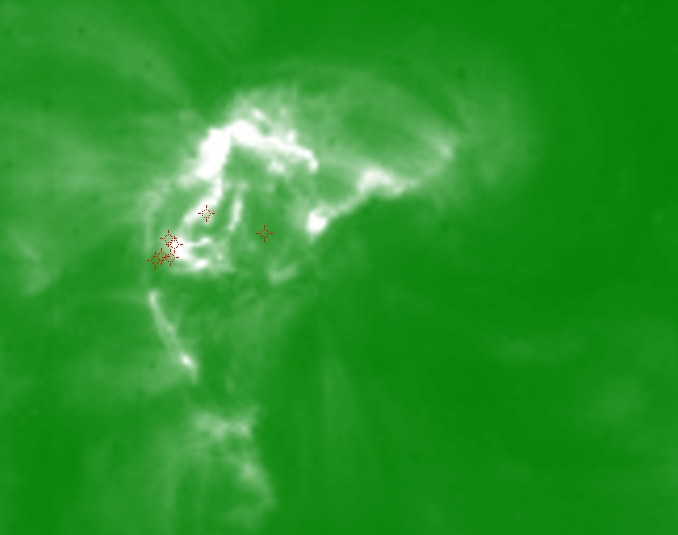
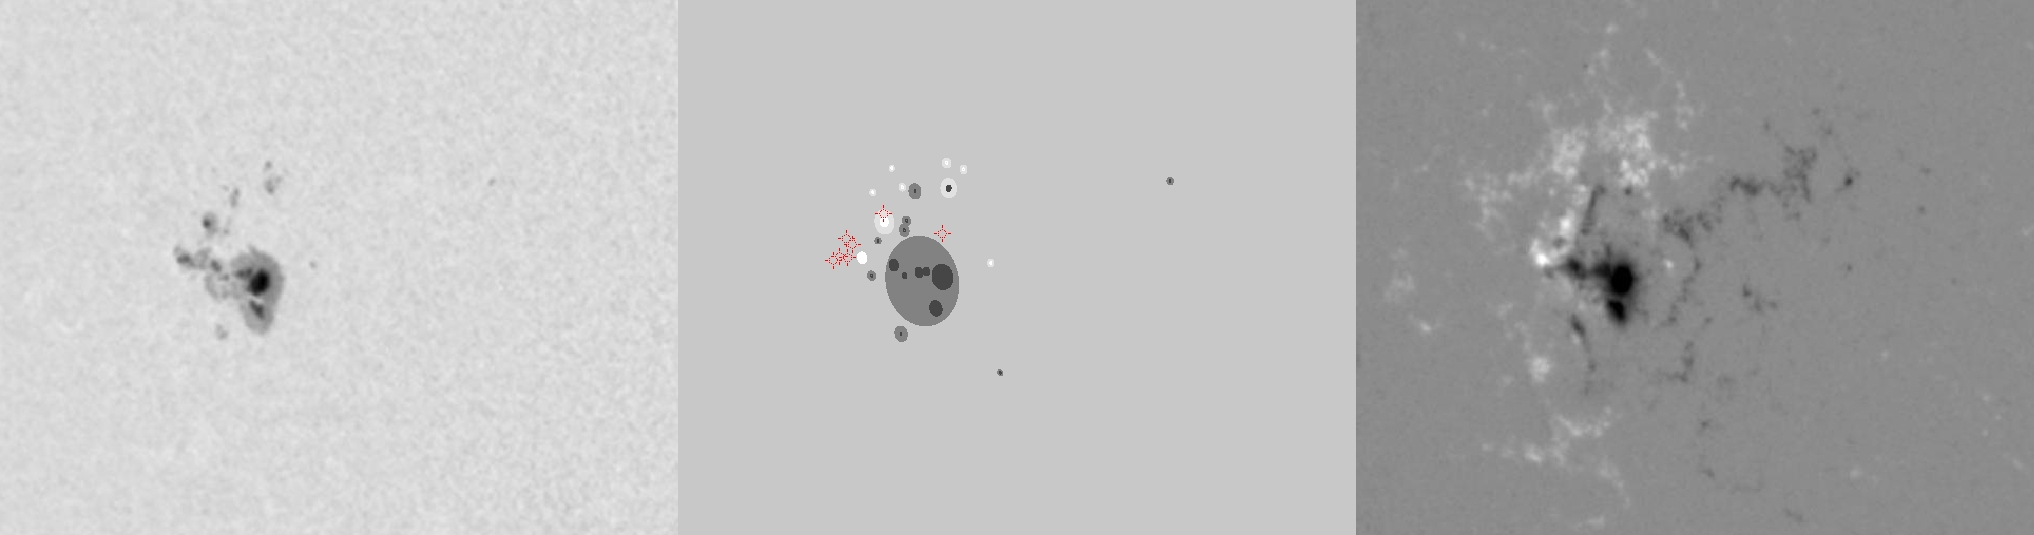
| Evolution of sunspot group NOAA 10875 and positions of flares in it animated by using the data of SOHO/MDI Debrecen Data (SDD) sunspot catalogue (lower panel, middle, ellipses with positions and areas corresponding to the relevant data of spots in SDD and with grey-scale colour coding of the magnetic polarities corresponding to that of the magnetograms), SOHO/MDI continuum images (lower panel, left) and magnetograms (lower panel, right), SOHO/EIT images (upper panel, middle), GOES and RHESSI flare data (red and blue symbols) observed within the interval around the time of SDD data. |
|
When you want to zoom in on one of the images, simply move the mouse pointer over that image. |
 |
| Year | Month | Day | Hour | Min | Sec | NOAA | Proj.U | Proj.WS | Corr.U | Corr.WS | B | L | LCM | Pos.angle | r | MU | MP |
|---|---|---|---|---|---|---|---|---|---|---|---|---|---|---|---|---|---|
| 2006 | 04 | 26 | 15 | 59 | 31 | 10875 | 126 | 877 | 80 | 548 | -10.62 | 114.79 | -37.34 | 101.49 | 0.6107 | -1020.3 | -315.9 |
| Flare | Date | Start | Peak | End | Dur [s] | Peak [c/s] | Total Counts | Energy [keV] | X pos [asec] | Y pos [asec] | Radial [asec] | B [deg] | L [deg] | Flags |
|---|---|---|---|---|---|---|---|---|---|---|---|---|---|---|
| 6042661 | 26-Apr-2006 | 15:50:24 | 15:50:46 | 15:54:56 | 272 | 48 | 55824 | 6-12 | -547 | -92 | 555 | -9.34 | 115.86 | A0 DR P1 |
| 6042683 | 26-Apr-2006 | 15:54:56 | 15:58:30 | 16:05:56 | 660 | 352 | 553056 | 6-12 | -605 | -107 | 614 | -10.02 | 111.28 | A0 |
| 6042614 | 26-Apr-2006 | 16:05:56 | 16:07:54 | 16:12:20 | 384 | 184 | 200160 | 6-12 | -608 | -106 | 617 | -9.95 | 110.97 | A0 |
| 6042662 | 26-Apr-2006 | 16:12:20 | 16:15:26 | 16:21:20 | 540 | 120 | 219696 | 6-12 | -602 | -95 | 609 | -9.31 | 111.46 | A0 |
| 6042663 | 26-Apr-2006 | 16:21:20 | 16:23:58 | 16:28:00 | 400 | 208 | 245328 | 6-12 | -576 | -79 | 581 | -8.46 | 113.49 | A0 DR P1 |
| 6042615 | 26-Apr-2006 | 16:28:00 | 16:29:06 | 16:33:24 | 324 | 72 | 91248 | 6-12 | -595 | -98 | 603 | -9.52 | 111.85 | A0 DR P1 |
| 6042665 | 26-Apr-2006 | 16:40:20 | 16:43:14 | 16:46:20 | 360 | 46 | 76752 | 6-12 | -604 | -108 | 614 | -10.08 | 110.94 | A0 |
| Date | Start | Peak | End | Classification | B [deg] | LCM [deg] |
|---|---|---|---|---|---|---|
| No data |

